Focus on Total Return to Manage Your Investments Better
In finance, there is a concept known as total return. The goal of total return is simple: To tell you what the overall results were to you, the owner, during a time period you held an asset. This includes any fluctuations in the liquidation value of the asset itself, profits produced by the asset and distributed to you as dividends, spin-offs from activity split off from the asset, etc.
Most investors ignore total return to their detriment. Instead, they focus on base return, which is nothing more than the liquidation value of the asset. To borrow a famous analogy that can help you understand total return, if I own a piece of farmland for $2,000,000 and then sell it ten years later for $2,000,000, a foolish person might say my return was 0%. Using the format used by most standard stock charts, that is how it would appear. In the real world, my total return would be 0% from the fluctuation in real estate prices + the aggregate profits generated from the crops that were produced during the decade I held the real estate. If every year, I were cashing checks for $200,000 from selling soybeans, corn, beef, milk, cheese, radishes, lettuce, carrots, peas, and watermelons, that matters. That has utility. You can’t accurately evaluate your overall investing results if you pretend as if that money didn’t flow into the treasury.
(If you’ve read the site long, you would know that I don’t think total return goes far enough, either. I’d adjust the final total return for inflation to calculate my real gain in net purchasing power.)

To borrow a famous investing analogy, if I purchased a farm for $2,000,000 ten years ago, and then sold it for $2,000,000 today, my return is not 0%. My total return would be 0% plus all of the aggregate profits I earned, taken as dividends, from selling milk, cheese, corn, soybeans, and cattle. Focusing on total return can lead to better, more complete investing decisions.
Why is this on my mind? I have a friend who constantly pulls up stock charts to examine how well the long-term holdings in his portfolio are doing. It drives me nuts because he never makes adjustments for distributions such as dividends or spin-offs. It leads to faulty decisions based on incomplete data. When it comes to analyzing stocks, of the two measurements, total return is the only yardstick you should use. Base return is useless. It is meaningless. It tells you very little worth knowing as it is only one half of an important summation. This is especially true in the area of mutual funds, which are required by tax regulations to distribute all of their dividend and capital gain income, thereby reducing the net asset value of the shares. You could have a mutual fund increase your wealth by 1,000% but appear as if the stock price never budged. He’ll still pull up the stock chart and mull over the change in share price!
To illustrate the concept so you don’t commit the same analytical sin, I thought I’d provide real world return vs. total return calculations to show you just how big of a difference total return can make when trying to understand the economic implications of holding a specific investment during a given period of time.
Return vs. Total Return for the S&P 500 Over the Past 5 Years
Let’s go back in time exactly five years. It is December 2nd, 2007. The United States economy is still in the afterglow of the peak of the real estate bubble. Things look good. We are running some national deficits, but they are mangeable. President George W. Bush was in office and Nancy Pelosi was running the House of Representatives in Congress.
This is as close to a peak as we can get for a standard measurement period – in this case, our five years. Things are about to get very ugly. Housing will collapse, stocks will crash, unemployment will skyrocket, bond yields will compress, and the national budgetary deficit will begin exploding. What if you had been unfortunate enough to invest your entire life savings – let’s say $500,000 – at this exact moment? How would you have fared?
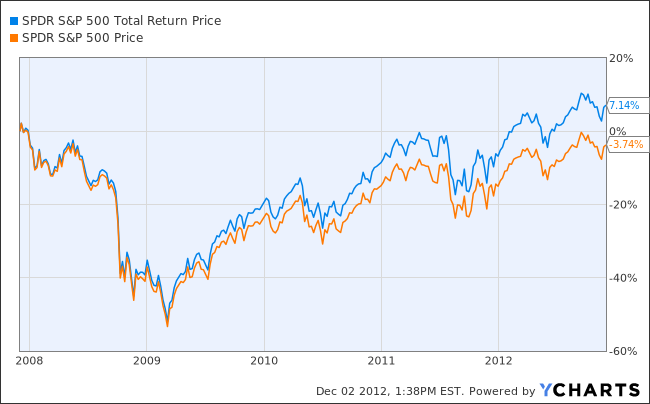
Had you bought one of the largest S&P 500 exchange traded funds, the stock charts throughout the world would show that you had lost 3.74%, or $18,700. You’d be sitting on $481,300. That may sound bad but it included a meltdown that marked the worst economic crisis in the United States since the Great Depression. Considering that many blue chip firms, such as AIG, lost more than 97% of their value, wiping out owners, you did alright.
That isn’t the entire story. You collected dividend checks for five years. All together, these checks were approximately $54,400. Factoring those into your returns, your total return is a positive 7.14%. That means before taxes, you ended up with $535,700 because your $54,400 in dividends offset your $18,700 in stock losses by $35,700.
That may not sound impressive but, again, considering that you put your entire net worth in the stock market near its peak and then watched the world fall apart in a crisis that hasn’t been seen in generations, this is about as good a result as one could expect from a broadly held basket of stocks. You should not sit around being unhappy about the outcome. That is life. You survived unscathed and your portfolio did its job.

The moral of the story is that you cannot look at stock charts to determine how well your investments have done. There is an enormous difference between ending up with $481,300 versus ending up with $535,700 after five years. Stock charts, outside of a few firms such as YCharts, do not provide a comprehensive total return view. This is a mistake. It is misleading. You are getting incomplete data.
A Look at Return vs. Total Return for Some Individual Stocks
The situation gets even more drastic if we look at some individual stocks. I did a few quick calculations to illustrate the point.

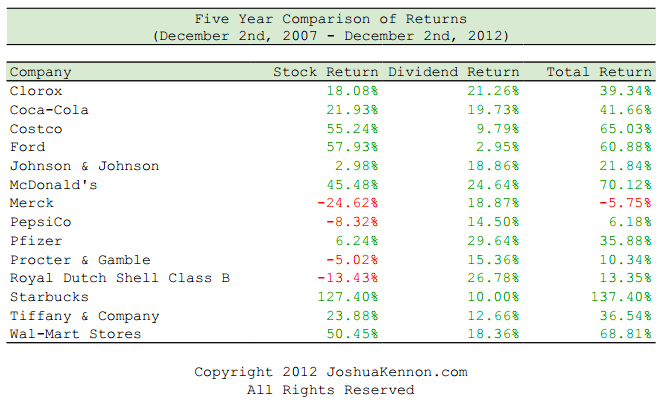
If you look at a stock chart for the last five years, it appears as if Merck has lost 24.62% of its value. Instead, you would only be down 5.75% in total when you factored in your dividends.
Likewise, Coca-Cola would appear to be up only 21.93% but factor in dividends, and your total return is 41.66% – almost double what it otherwise appears!
For high growth companies, such as Starbucks during this period, total return is not nearly as important. Still, an extra 10% on principal is significant. For our hypothetical $500,000, that would have meant an extra $50,000 in cash at the end of the period. I don’t care how rich you are, having an extra $50,000 lying around is never a bad thing.
None of these figures include what would have happened if you’d reinvested your dividends. In almost all cases, this would have resulted in higher returns because the money would have gone back into buying additional ownership, which itself grew and paid dividends.


