We’ve had fun over the years answering the question, “How much money does it take to be in the top 1%?” and even looked at the breakdown of how the top 1%, as a class, generates its money. If you enjoyed those posts, hold on to your seat because there is a new report out that details income statistics by state for the purpose of looking at income inequality.
[mainbodyad]While the document itself engages in the sort of dishonesty I talked about in lies, damned lies, and statistics (e.g., looking at the mean, or average, income for the top 1% is for all intents and purposes meaningless because people like Bill Gates and Warren Buffett pull the figure far higher than the typical member of that class experience so the correct figure to use if you were interested in painting an intellectually honest picture would median income) and it is horribly ideological in its motivations (read the opening two sentences – there is absolutely zero attempt to hide the bias here as the authors expect you to take it as a matter of course that income inequality in and of itself is undesirable relative to past levels without providing any of the detailed, nuance analysis that thinkers like Peter Drucker did on the topic when he looked at the economic allocation problems mass automation were likely to cause civilization), it is a fantastic data set to add to your proverbial file cabinet. You can download it here as an Adobe PDF file.
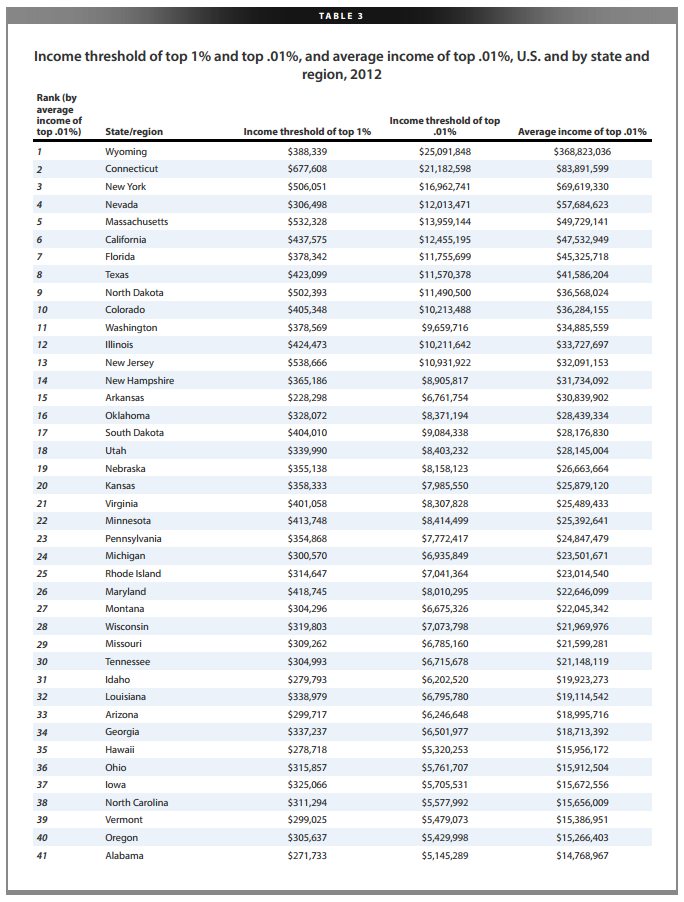
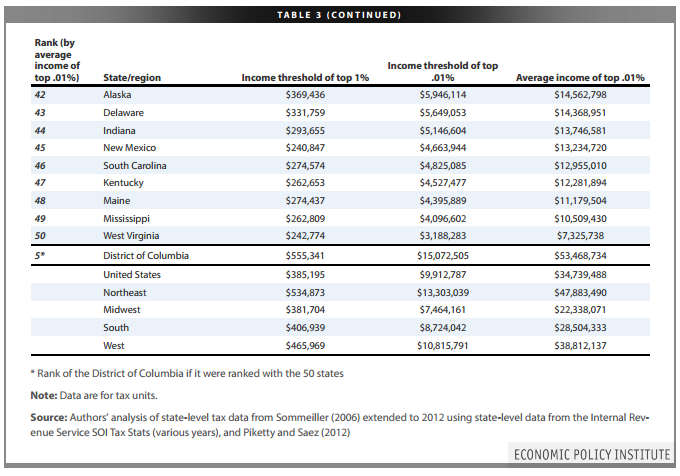
Particularly interesting is Table 3, which provides the income threshold necessary to reach the top 1% of income (not wealth – a very different thing) in your state, as well as the top 0.01%. (In the off-chance you haven’t dealt with percentages in a long time, in practical terms, the top 1% gives your household a higher income than 99 out of every 100 of your fellow citizens, while the top 0.01% gives your household a higher income than 9,999 out of every 10,000 of your fellow citizens.)
This data is broken down, and was even republished in The Wall Street Journal, in this convenient map:
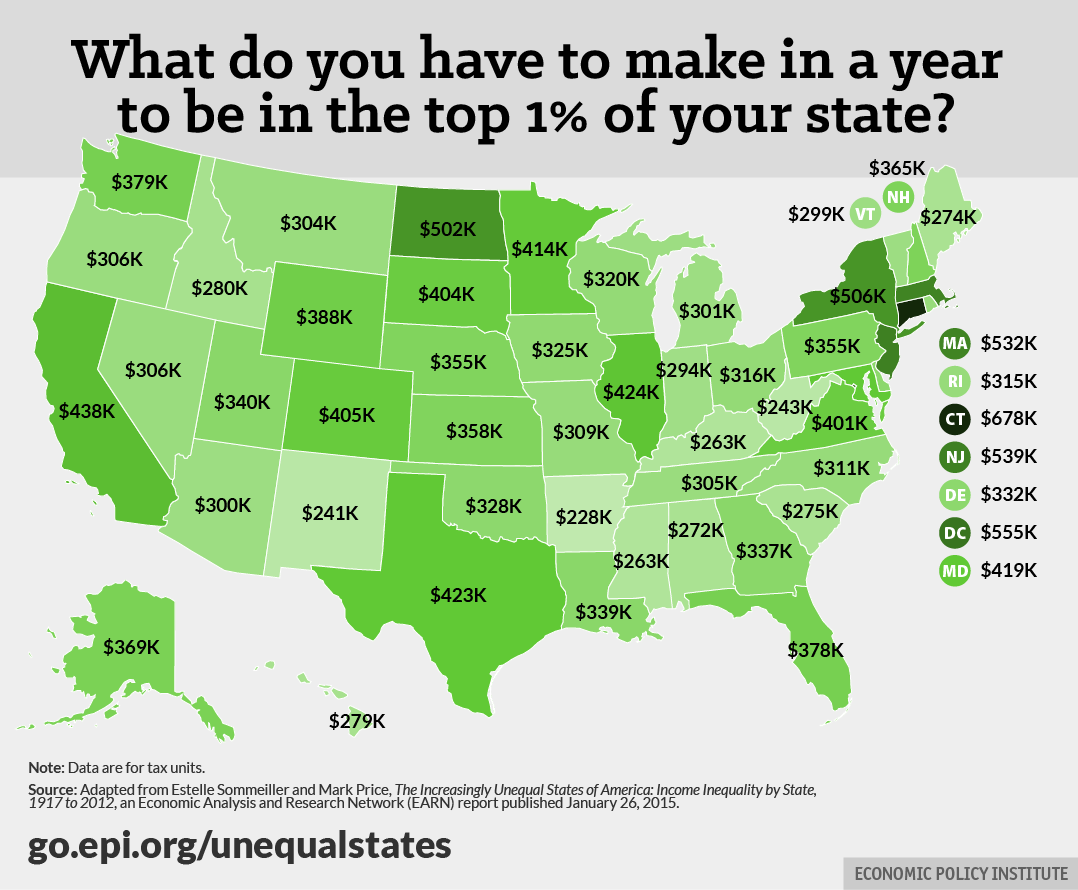
In my home state of Missouri, for example, you need to make $25,750 before taxes per month to earn more than 99 out of every 100 of your fellow citizens’ households. Meanwhile, in New York, it’s $42,167 per month because there is a lot more aggregate wealth and your cost of living is substantially higher. In Tennessee, it’s a mere $21,917 per month (plus you don’t have to pay state income tax on any of that money unless it comes from dividends and interest, allowing you to keep a much bigger percentage). Connecticut obliterates the rest of the list where it takes $56,500 per month to rank in the top 1% of household income.
[mainbodyad]Even that is somewhat misleading as every state has its own trade-offs. A person in the top 1% in New York can live comfortably but certainly not extravagantly. In exchange, he or she can walk outside of the apartment building and experience world class music, shopping, dining, sporting events, and cultural experiences. A person in the top 1% in Texas who has spent most of his or her career saving and investing can live like a member of the royal family if the cards are played intelligently enough; e.g., live outside a major city with most of its advantages, including being near an international airport for global travel, while lording over an 8,000+ square foot mansion on a multi-acre estate driving a Maserati and wearing $6,000 Brioni overcoats if that’s your cup of tea.
For fun, cross reference this with the interactive feature The New York Times put together on the top 1% households to find out the type of work the class does. If you want to be in the top 1%, consider becoming a physician. Roughly 1 out of every 3.68 doctors in the United States are also in top 1% households. That is statistically meaningful. Compare that to chefs and cooks, where only 1 out of every 333 make the top 1%. If a high standard of living is your primary objective, tilt the probabilities in your favor by going into a field capable of disproportionately producing affluence and that matches your interest and skill set.
What is really fun, though, is if you look at some other data that we’ve also talked about in the past. While only 1 in 50 or 1 in 100 engineers end up in the top 1% of income (which is the focus of this data set), they disproportionately end up in the top 1% of wealth. How do engineers achieve this? It seems it comes down to their dexterity with numbers, which is all money is: A financial construct expressed in numerical terms. They tend to focus on things like life-cycle cost (e.g., cost per use rather than initial sticker price), gaining all these economies of scales and tax efficiencies that add up to something meaningful due to the power of compounding. Dr. Stanley at the University of Georgia quantified this ten or twelve years ago when he found that for every $1 in income an engineer earned, he or she transformed it into a vastly disproportionate amount of wealth compared to $1 in income earned by, say, a doctor. That is, the engineer might earn less than a surgeon (which is relative here as engineering is a great field, dominating the list of best paying college degree investments), but he or she is able to much more efficiently convert household income into net worth. In other words, the engineer is the guy who might end up making $80,000 or $100,000 a year, drives a Toyota, but retires with $5,000,000 worth of oil and bank stocks pumping out $250,000 a year in tax-free dividends which he gets to spend but that never show up on his income tax filing because of the way the asset is held in a combination of self-directed Roth IRAs and Roth 401(k) plans.
Reader Comments (38)
Comments are presented chronologically, with replies indented beneath the comments to which they respond.
RapmasterD
January 27, 2015
Great post. I saw a variant of this in CNN Money. I agree with your comment about the value of median versus average income in spades.
And here is one more: how meaningful is a state by state analysis for many of our states? For example, in Connecticut you've got your highly affluent Greenwich-New Canaan-Westport belt...and then you've got pretty much everything else. It's not too frothy these days in Hartford, for example.
And in California, you've got the lovely San Francisco Bay Area and the LA scene for hyper affluence, and then you've got PRETTY MUCH the rest of the state. I understand the picture may be more level in many states, but....(another example) New York State? Not so sure.....
The state I grew up in is among the 10 most affluent. The city I grew up in has a median household income well below the national average....for median household incomes.
SFrentier
January 30, 2015
Replying to RapmasterD
I agree. These state stats don't mean jack. Comparing metros may be more interesting, but we already know how bifurcated wealth is in Amerika. 30 years ago it was not like this. But, hate the game not the player, as they say. I got mine, but again I chose to live in San Francisco where $1 million doesn't get you very far. During the Great Depression I ironically changed my handle to poor.ass.millionaire, for good reason (I'm back to SFrentier now though :). Now that our RE values are phat, it's all good. Though I shudder to think how those without much assets are doing. And with insane university expenses, those starting out have to be much smarter and savvier about planning for their financial future. Let's hope the economic recovery keeps chugging along the next few years. Cause I tell ya, it ain't gonna come from Europe or China. This time it's on us baby.
Erich
January 27, 2015
Very interesting point about engineers, as I am an engineer myself. I wonder how many studies were conducted on engineers ability to create wealth over their lifetimes using their above average (but certainly not astronomical) salaries and adeptness at mathematics...
Engineer7006
January 27, 2015
Replying to Erich
I'm not aware of anyone having done a study on it, but unlike most other professionals, engineers don't have the social pressures to have a fancy house/car/suit. That is to say people don't judge engineer's competency based off exterior appearances like some might do with a salesman/real estate agent.
As an engineer myself, most of my engineering friends are stealth wealthly, avoid debt and tend to marry women who don't care that much about material goods.
crispy
January 27, 2015
Replying to Erich
It may just be feeding into a bunch of stereotypes, but I believe this is spot on and also reinforced by the fact that until very recently, every engineer I met entered the field because they wanted to do engineering more than anything else in the whole wide world. When the wealth comes it truly is a bonus.
Most of the lawyers, businesspersons, and similar that I've met entered the field because they wanted to have the trappings of wealth. It's significantly more difficult to have the trappings of a multimillionaire and the multiple millions at the same time.
joe pierson
January 27, 2015
Income inequality in and of itself is undesirable relative to past levels, maybe not preventable due to automation, but undesirable nonetheless, it's a good assumption IMHO.
Joshua Kennon
January 27, 2015
Replying to joe pierson
Why? What made a brief period of time during a few decades in the 20th century so desirable? Is it really the income inequality or the disconnect between political power that it has created due to the corruption in your legislative process where insider trading is permitted, unrestricted expenditures are tolerated, and regulatory capture is a real threat, especially in bodies such as the FCC?
Is it the inequality itself that is the problem or the absolute standard of living for the bottom, say, 20%? In other words, if I could waive a magic wand and double the real standard of living for the bottom 1/5th of civilization, but it would also double income inequality, would you want me to do it? Why or why not?
To flip the question, if we could substantially lower income inequality but it required reducing everyone's standard of living by 15%, would you want me to do waive that wand? Why or why not?
I've sort of tipped my hand already in mentioning I think we have a concentration problem that could lead to some non-desirable economic and political consequences but I'm curious as to what, specifically, you think the problem is. Do you think inequality by its very nature is so bad or do you think is the by-products of inequality which we could, as a society, mitigate if we desired? In other words, if a college education and comprehensive healthcare were available at low or no cost to every citizen, would you care as much about inequality? What is the underlying concern you have with its levels relative to the past? How can you be so certain it isn't just a manifestation of a mental model known as price anchoring in behavioral economics?
joe pierson
January 27, 2015
Replying to Joshua Kennon
To answer your first question, no, second yes. Absolute standards (above a certain minimum of sanitation, food, shelter etc) are not the problem. Civilization is ultimately about fairness, jungle rule is about winner take all, so someone with a slight advantage gets all the benefits. The resulting wide income gaps then create a sense of hopelessness (due in part to envy, jealousy which we can't eliminate) so people turn to drugs, theft,... they start gaming the system (via welfare/SSD abuse you seen in the last 5 years). And these are otherwise honest people.
Allen Jarboe
January 27, 2015
Replying to joe pierson
Joe, what do you mean by fairness? How would you frame society so that everything is fair?
Also, so when you say absolute standards are not the problem, you are focussing your discussion on the relative inequality in the United States and Western Europe for example? (ie within a specific country?)
joe pierson
January 28, 2015
Replying to Allen Jarboe
Allen,
I don't know how to make everything fair, just because we don't know doesn't mean we should somehow convince ourselves it ok.
Rob
January 27, 2015
Replying to joe pierson
I have to disagree. Civilization is not about fairness in any sense of the word. It has to do with a centralized, stratified society...fairness is a non-sequitur. As for your point of a sense of hopelessness, it reminds me of what my father told me when I was younger regarding sports (this is not a perfect analogy but I believe it gets my point across), "...losing will make you jealous, and it will make you mad, but it will also make you work harder so next time you are in a better position to win." Plenty of people come from nothing and have made fortunes. Plenty of people have come from fortunes and lost it all...but saying income inequality causes detrimental acts from otherwise honest people is inherently false; these very acts make them dishonest, regardless of their excuse for doing so.
pilover314
January 27, 2015
Replying to Rob
It is about relative poverty whether we like it or not. People will clearly kill someone over a better iphone, and not because they need the extra processing power for facebook. Relative poverty doesn't make rational sense, at least to me, but it is reality. As described in Joshua's posts when I enter a grocery store my comparison is to that of a Roman emperor and how I have a bounty available quite cheaply which would make nearly all of human history insanely jealous.
Rob- As Buffet describes a lot does have to do with the lottery of life. Yes, a number of people with low IQs have become wealthy, or those born in terrible circumstances. It is an exception, not a rule. The cruel reality of life is that IQ and life circumstances dictate far more than we would like to admit. Relative inequality demonstratively leads to detrimental acts. Would you enjoy living in downtown Detroit as a billionaire? Compare that to say Monaco. That is an example of relative inequality and its effects. That does not mean that we should or should not do something about it, however pretending that it doesn't exist does no favors.
Shouganai
January 28, 2015
Replying to pilover314
"It is about relative poverty whether we like it or not. People will clearly kill someone over a better iphone"
Only by taking an extremely narrow view of "relative poverty" can a focus on reducing it be made to seem in any way a good (sane) idea.
I mean, if we are to legislate based upon this assumed, inevitable jealousy, why the focus solely on our relative abilities to access (luxury) goods in the market? That is actually more or less completely irrelevant.
Why not focus on our physical abilities? Our personal relationships? Mental health? Elliot Rodger, anyone? Friends by lot, breeding camps?
Better to acknowledge that jealousy is a sin, and not something that we should base our social system upon.
Next time I see someone arguing in favor of reducing relative poverty, I'm going to demand that they stop writing as I'm jealous of their style.
pilover314
January 28, 2015
Replying to Shouganai
I think you'll notice if you re-read that I made no value judgements on relative poverty. I don't quite follow your argument, which appears to be a fallacy, that somehow relative poverty is equivalent to friends and mental health, or that you are jealous of your friends writing styles?
Shouganai
January 28, 2015
Replying to pilover314
Fair enough... to directly address what you said, personally, I don't think that any idea as mad as relative poverty can significantly influence most people's thinking.
The argument was this: presumably relative poverty will be important because people don't want others to have things they can't have. But actually, the real impact on your life of upgrading to a rolex from a casio is vanishingly small - at least until the more important needs, health, relationships, etc. are dealt with.
So if it were the case that jealousy of other people's trinkets were a significant issue in society, why on earth would it not also be the case that jealousy of other people's relationships, health, and talents (all of which are more important to our experience of life than luxuries bought in the market) would also be significant?
If it is offensive for one man to have more power than another, why should it matter if that power derives from his bank balance or his eloquence?
Is that fallacious?
joe pierson
January 28, 2015
Replying to Shouganai
Better to acknowledge reality then ignore it by claming it's a sin.
RapmasterD
January 28, 2015
Replying to joe pierson
What is "reality?" And what is "fair?" These are two terms you have mentioned in your comments -- both of which are abstract...meaning I don't think you could fine 100 people that would agree on what the definition is of either of these terms.
Shouganai
January 28, 2015
Replying to joe pierson
Surely the first step towards improvement is identifying the problem?
Andrew
January 31, 2015
Replying to Shouganai
Politics. Corruption. Nothing to do with jealousy.
joe pierson
January 28, 2015
Replying to Rob
"But it will also make you work harder so next time you are in a better position to win."
Up to a certain point, but eventually you will break, life is messy, yes plenty of people of come from nothing and made fortunes, but his is the minority, the 1%, does your personal ethics not go beyond the 1%?
Rob
January 28, 2015
Replying to joe pierson
I'm having trouble following your argument here. 'Eventually you will break.' Do you mean give up and stop trying? Turn to crime and attempt to game the system (as you state in your earlier response)? Also, I believe you mean morals, not ethics, but even so, my individual principles on right vs wrong extend to everyone. An individual who completes college empirically has greater earning potential than those that do not. Is a more desirable skill-set considered 'unfair' to you? Should those who have worked for years to earn credentials that increase their wages then be subject to penalties to subsidize those who did not make similar choices?
Shouganai
January 28, 2015
Replying to Rob
"Should those who have worked for years to earn credentials that increase their wages then be subject to penalties to subsidize those who did not make similar choices?"
Yes.
We have a competitive system - those who are best at a particular task gain the right to use capital and social structures to produce things. But it doesn't follow that they should therefore have the right to everything that is produced from this combination of factors.
I like to think of it like a game of soccer. It's really bad form to throw a hissy fit when you lose, but also equally bad form to starve people to death for being bad at soccer.
Alex
January 28, 2015
Replying to Shouganai
I had to do a double take when I read your response and based on it I can tell that you most likely want increased taxes for the wealthy. My assumption may be wrong, but that is typically the case for those that would agree with that statement. You and I definitely have different ideologies because you're saying that if I was hypothetically born dirt poor yet took responsibility for my life and decided to go through 4 years of undergraduate study, 4 years of medical school, 2 or 3 years of residency AND a 3 year fellowship to finally become a licensed gastroenterologist and earn $350,000 per year that I should then be punished and have to take some of my hard earned income and use it to subsidize others, who may have very well been born with much more, who didn't put it upon themselves to improve their position in the world because in your words I would be "starving others". I believe that in this life you are owed nothing except your rights and your time. It is YOUR responsibility to live the lifestyle you want, not mine nor the government's (keep in mind I very much support social programs and the government subsidizing the basic needs of unfortunate people because I believe that it helps to give opportunities to then earn the lifestyle you want). The idea that it is my fault that other people didn't take it upon themselves to do the work necessary to improve their lives is ludicrous. Additionally, finance is not a zero sum game. (In America) We live in a 17 trillion dollar economy that is constantly growing, there is ample room for everybody to achieve their goals. And finally, going with your example, If I suddenly become insanely good at soccer (through merit and handwork), I am not going to try and hold myself back so that others can win a couple of trophies. I'm naturally going to use my hard-earned skills to become the best I can possibly be.
-Rant over-
Rob
January 28, 2015
Replying to Alex
Your response is much better articulated, and more polite, than mine would have been. I have no idea how it is possible to go from 'throwing a hissy fit when you lose' to 'starve people to death' but here we are. I consider myself an educated individual who was fortunate enough to grow up in an environment that placed an emphasis on education (not wealth; didn't come from it, don't have it). I have student debt taken on from graduate school, and consumer debt from enjoying my 20s much more than I prob should have. These were my decisions, and I am fine with that. A lot of people have a higher income than I do, a lot of people have a lower one. However, I have not once expected anything from anyone nor do I have patience for those that think they 'deserve' something. No one owes anyone anything. If I desire a higher income, I will learn another skill and/or change occupations. If you have a more in demand skillset such as doctors and engineers, or you have taken the risk to start a business and been fortunate enough to be successful, you enjoy the fruits of that labor. It is very simple.
Shouganai
January 28, 2015
Replying to Rob
"I have not once expected anything from anyone nor do I have patience for those that think they 'deserve' something. No one owes anyone anything."
I'm not sure that you have being attention to how society works.
Shouganai
January 28, 2015
Replying to Alex
"I am not going to try and hold myself back so that others can win a couple of trophies....keep in mind I very much support social programs and the government subsidizing the basic needs of unfortunate people"
Isn't that what I said?
I actually have a lot of sympathy for what you are saying here, but there are a few places where we may disagree.
Firstly, regarding the question of who should own the fruits of production, I believe that Obama put it best when he said, "You didn't build that." The majority of productivity derives from existing social structures, knowledge received from others, and capital rather than individual effort.
Secondly, your argument hinges on a particular (and quite attractive) view of "fairness". It is fair to get what you work for. But I would suggest to you that people are not always rewarded according to their efforts. That many people working on low wages work harder than those on high wages. That my success in the market is only partially decided by my own moral qualities. That a focus on work may be damaging.
Thirdly, there is no consent to the social system into which you are born. There are good arguments for alternative distributions of wealth and for not changing this by working within the system. As such I would be inclined to give the socialist baby his bottle with respect to a decent minimum for the lazy (which would also have the advantage of making it easier to justify golden watches for the rich.)
pilover314
January 28, 2015
Replying to Alex
Alex, your post relies on an idealized set of circumstances in a world which doesn't exist. The reality is that the biopsychosocial sphere of our world is not even, and often times those factors associated with the bipsychosocial realm are what determines in large part outcomes. For instance, we may not like it, but IQ is correlated to income. Smart people make more money. You posit a situation where a meritocracy reigns and it is only through laziness that many fail, except of course for those who you describe that need the social programs. You say you support some of those but also describe taxation as a punishment for success, which is a curious juxtaposition.
Your post represents a common theme in the merit-based approach to life. Cognitively we don't want to admit that it isn't our own achievements many times which provide us with wealth and our standard of living, and that perhaps the person with a low IQ might not simply be lazy. We want an idealized society and fit our worldview into that concept. That's not reality.
pilover314
January 28, 2015
Replying to Rob
Your theme in this post is that taxes are penalties and that it is not fair. The fairness aspect is interesting because you describe fairness as a value, while at the same time ignoring that things aren't fair. That doesn't mean that they should be either, because things simply cannot be made to be fair. Similar questions can be posed to you though. Should people who didn't have the same opportunities as you, or have some other deficiency not do themselves be punished by an unjust society (I don't think this question is phrased in a valid manner, and use it to illustrate that yours is not either). The dialogue on this topic is loaded with extremes and many cognitive biases which present themselves repeatedly.
Joshua Kennon
January 28, 2015
Replying to joe pierson
Personally, I'd answer the questions exactly the opposite; the first question, yes, the second question no, but that is because I think we are ultimately destined for for a post-necessity economy, whether it is in a century or a few thousand years, I have no idea. Every bit of progress we make pulling up the bottom 20% without harming the freedoms of everyone else too much, if at all - which is how I measure advancement - is a step in that direction.
I'd prioritize it - the absolute standard of living of the poor - over most other things.
In other words, if I were able to usher in a Star Trek economic system where everyone had more than enough food than they could ever eat, health care was instantaneous, miraculous, and free, opportunities for advancement were based on merit, entertainment was endless in the form of a holodeck that unlocked synthetic God-like creation abilities for endless personal expression, etc., whether one person owned 1 acre and another person owned an entire planet would mean nothing to me provided the attainment of those resources was not based upon manipulation of political power or unearned in the form of rent-seeking activities or dynastic inheritances.
Of course, it is somewhat of a misdirection in the sense it is not axiomatic or inevitable that increases in the bottom's standard of living necessitate greater income inequality, though I think history has shown there does seem to be some correlation (the usual caveats about causation inserted here). Still, I think it's a useful tool in terms of identifying what you are really attempting to accomplish when examining economic solutions to the challenge wealth distribution presents.
If we were looking at policy proposals, for example, you would be weighing the difference between people whereas I'd be looking at the real standard of living for the bottom 1/5th of society, trying to improve their absolute standard of living. In essence, we would be defining success differently, which means the number of proposals that would meet both of our criteria was greatly reduced. It's useful to know that.
It very well could be that my position is a combination of my personal genetic wiring and cultural experiences growing up because like @pilover314:disqus, I measure myself by my absolute experience; I, too, walk into a grocery store and am hit with a burst of happiness, thinking I'm the luckiest man in the world to live surrounded by such affluence. The fact Bill Gates has exponentially more purchasing power doesn't mean anything to me due to the lack of utility beyond a certain point. If I could lengthen my lifespan, or get a car that drives 300 miles per gallon in absolute silence with higher safety, I'd make the trade even if it meant the differential between us doubled (earlier qualifiers about such outcome not at all being established reiterated here).
It is entirely possible that those of us who are missing this chip in our hardware underweight how devastating envy is. I had a woman write me once about how she was struggling with it; how no matter how far ahead she got, she was consumed by this slow, burning desire to take from others and it was poisoning her life because she could never be happy for someone else. She talked about how she couldn't shed herself of the burden no matter how hard she tried. The way she described it was heartbreaking because you could tell there was just something going on in her mind that was a by-product of chemicals, not necessarily a choice in the sense most people think of the word.
Yet, I'm just not able to get myself to say we should arrange society around mitigating that shortcoming except to the degree necessary to prevent a French Revolution as I'm more inclined to think we do what works best for the most number of people. That is, we're never going to eliminate all suffering so we isolate it to the smallest number of cases we can and focus on the greater good. I, personally, have a hard time pandering to personality flaws (I'm ruthless on myself, too, when I fall short of the ideal.) For example, I think it's idiotic for women to be expected to cover their bodies, head, and faces to mitigate men's lust (which manages to not only be misogynistic but also misandrist in that it presumes men are essentially uncontrollable animals incapable of restraining themselves, which plays into this narrative in civilization lately about men being inherently violent that has been much discussed in certain circles). It strikes me as patronizing and ultimately harmful in that it infantalizes people in the same way the woman who became a viral hit for saying she was no longer going to wear yoga pants as her body might tempt men to look at her lustfully is. Even though I think dressing modestly is a perfectly acceptable lifestyle choice, her motivations for doing so seem condescending and juvenile to me.
I find myself in the same situation whenever casino proposals are put on the ballot. While I am not a fan of mispriced bets myself, my grandmothers are crazy about slot machines and get tremendous entertainment from them. Is the rest of society, which is benefiting from their existence and enjoying themselves, supposed to deny the experience simply to make it easier for those who can't handle it because of a genetically influenced or psychologically conditioned addiction problem? I can't get myself to say yes. I say you give entertainment to the vast majority for whom it will add to the quality of their lives, and it's the responsibility of the 2% who destroy their families because of their inability to control themselves to find a way to mitigate their own behavior.
There's a worldview at play involving my own sense of fairness. I think it's fundamentally unfair to expect everyone else to enjoy less of whatever it is because some small minority might find it emotionally distressing or destructive. Whether it's unequal outcomes in life, differentials in beauty, the availability of alcohol, the decision to build a new casino ... making things "equal" in terms of outcome is anathema to me.
I do want equality of opportunity, though, and that is what I think is sorely missing at the moment relative to some times in the past. The way the tax structure has become increasingly more regressive on the bottom half of society, for example, strikes me as unfair. We've taken the payroll tax from 2% to 15.3% for self-employed workers over the past 60 or 70 years, many states have increased the sales tax they charge on basic life necessities such as food and clothing, the tax break system for savings incentives disproportionately rewards high income families, etc. If you are born into a poor family, in a bad neighborhood, and have to dodge bullets to get to school every day, a single bad decision could derail you for life as all of these reinforcing variables begin to exert an influence, locking you in a cycle that can be nearly impossible to break.
Those are the things that concern me when I think about fairness. The outcome itself? Not so much.
Then again, during my morning reading session, one of the old books I'm working my way through at the moment was talking about the fundamental flaws in meritocracies as they are necessarily totalitarianistic in their very nature; they lead people who are otherwise good and valuable to society to be deemed worthless or less-than, because they have no market value to their fellow man. The arguments are good but I'm not sure I can get myself to buy into it because it inevitably devolves into people who think they have value, but are really just parasites, demanding more and more from the productive. History is full of too many real-world experiments of it ending in lower standards of living, lower life expectancy, bloodshed, violence, loss of freedom ...
It's a big topic. In any event, thanks for giving me your answer. If you and I were in a Congress of two, we'd be looking for some sort of policy that simultaneously raised the bottom 20%'s standard of living in absolute terms while decreasing income inequality in general. Off the top of my head, the only system I can think of that comes close is Milton Friedman's proposed negative income tax. Long story short, you dissolve all government benefit agencies, and take all of the money you were sending out the door and, instead, just issue every single citizen a basic dividend or guaranteed minimum income. You'd have to restrict the amount in the constitution so people couldn't vote themselves increases beyond inflation but it would establish a necessary floor for a given society without requiring confiscatory tax rates or creating systems that encouraged fraud.
Alex
January 29, 2015
Replying to Joshua Kennon
While I think this discussion is extremely interesting in terms of defining exactly what would constitute an ideal society (or at least a framework of incentives that would make us tend towards it), I think that the implicit assumption upon which it is predicated has a few holes in it.
While I completely agree with Joshua in the sense that we seem to be heading for a post-scarcity world (at least in places in which we do not artificially create it, which is a whole - also interesting- discussion onto itself), I believe that the notion that economic development since the industrial revolution has led to radically unequal wealth distributions stems from an incomplete portrayal of what "wealth" (or capital) is. I think the best explanation of this - to my knowledge - is in (economist) Deirdre McCloskey's essay on Piketty's work regarding inequality. Here is the link: http://www.deirdremccloskey.org/docs/pdf/PikettyReviewEssay.pdf
I thought it was truly fascinating and I highly recommend it, as I think it can help resolve part of the disagreements regarding this topic. Essentially, she argues that we are dramatically underestimating the "wealth" of low "net-worth" individuals by not taking into account, among other things, human capital. Indeed, the skills and abilities (which, after all, is what a nation's wealth really is) that people leverage in order to obtain financial capital has dramatically increased over the past few centuries, and it seems to be much more "equally" distributed than we think. This is compounded by the fact that she argues that the level of improvement in bottom-quintile living standards created by innovation is commonly vastly underestimated (which goes in the direction of Joshua's previous utility-inequality argument).
innerscorecard
January 27, 2015
I think that when it comes to the topic of evaluating career choices, expected income should be heavily discounted for when it occurs in one's life cycle. Income that comes later in life, as in the case of medicine, is worth far less than income that comes earlier in life, as is the case for engineering. It's doubly so when there are extremely high fixed costs incurred, due to regulations, in obtaining the former.
SFrentier
January 28, 2015
Income inequality simply is a very real phenomena. Why don't you guys get that? Josh's weird Ayn Randian rationalization may work well in his head, but not in the real world. And to think if all of a sudden everyone had a high IQ and supportive life circumstances, the bar would simply be raised. We have had more college grads the last ten years than prior decades, yet on a macro level income inequality has grown.
Having said that, the usual political solutions involving wealth redistribution, are equally troubling. I think you have to accept a certain amount of it in capitalist societies. And transforming from an industrial based economy to one based on information and technology has exacerbated the issue.
The solutions are messy compromises and offer no ideological satisfaction. As examples, Obamacare, executed well, will help. Increasing minimum wages, at least in expensive metros, will also help. But these are bare minimums that come only a step or two away from having social revolutions on the streets. In general this country hates government mandates, so when they come, it's usually due to back logged dire circumstances.
Technological advances have had significant impacts on society, and those impacts are not distributed fairly. Not by any means. Some folks have benefited greatly from them. Some got left behind. We have certainly seen an increase in newly minted millionaires, as this and other web sites are wont to capitalize on. At he same time there is a marked gutting of middle class middle America. Some will adapt, but many won't. Social and political change will come minimally, and as a last resort. That's how this country's political apparatus functions.
Finally, there is all the psychological issues of: jealousy, people expecting to do as well as others, unintended consequences of government programs, charlatans jumping on convenient soap boxes, political opportunists...and all in the name of social justice.
Expect more of the same. For this is America.
Joshua Kennon
January 28, 2015
Replying to SFrentier
I gave no rationalization for income inequality and have even spoken about my concerns regarding its consequences while otherwise remaining silent. You're projecting or fabricating things in your own mind.
What I want to know when someone speaks against it is why they think it is a concern and how they think it can be fairly mitigated to understand their thought process. It's entirely Socratic for the sake of efficiency.
Even if I were in perfect agreement with someone on a topic, but I wasn't sure how they arrived at their conclusion, I'd sit and talk with them for awhile, dismantling their (and my) beliefs so we could try to examine all the pieces on the table to spot implicit assumptions, our own bias (which inevitably exists), mutually exclusive conditions, and other flaws. You cannot extrapolate my beliefs on anything by the questions I ask (nor many of the people here). With income inequality, for example, are we concerned about the absolute standard of living for the bottom 20% of society? Or are we trying to mitigate jealousy? Where you go after that depending on that answer is radically different so it's important to flush out what, exactly, you are attempting to achieve.
Please stop ascribing positions to me that I do not hold, even in passing, or attempting to guess how I feel about something because you're probably going to be wrong in most cases. If it's not evident by now, you will almost never be able to tell where I stand on an issue by the questions I ask.
SFrentier
January 28, 2015
Replying to Joshua Kennon
1- My Ayn Rand reference is simply based on your above response. Nothing wrong with your why and how questions, but your tone suggests that if you don't/can't answer them than the issue is not important, or readily overcome by other factors. Perhaps elsewhere you have spoken on these issues, but above your tone came across a bit cold and insensitive. No big deal, we can only respond to what we know and see IRT.
2- the point of my post was exactly to delve deeper into the why and how. IMO it's not simply a matter of rectifying electoral concentration of influence. Wealth and politics commingle since the dawn of civilization. It's human nature, and to think you can mechanically separate them is wishful thinking IMO. My basic position is that income inequality is part and parcel of a capitalist system. When circumstances skew too far in one direction (like these days) politicians will cater to that need, and maybe some policies will change. Look at the controversy over Obamacare. For the record I am not uniformly for or against this policy. What really matters is how efficient it is, and we won't know that for years. And like all big and controversial political matters it will have some good effects and some bad ones. And it will be easy to choose a side you like and argue your position ad nausea. Nothing really resolved.
3- as far as some of the other questions you alluded to...price anchoring, wealth concentration/instability, absolute standard of living vs. top earners...those have all been debated and covered in many places. One's specific answers doesn't really reveal much, since they are still usurped by the life philosophy bias of the person. In other words, there are no "correct" or purely rational answers. One's rationality is the biased judgement of another. One's answers still basically paint a socialist vs Capitalist orientation, nothing new there. It's like I could easily argue either side. But the underlying motivations, life conveniences, interpersonal beliefs, psychological makeup and fears are far more interesting. Life is messy and as a society we are going to continue to fumble our way. We may collectively improve on some things, but sure enough there will be new and equally challenging problems to ponder. Ultimately what's in your mind and heart is at least as important as what's happening out in the streets. I'd just rather do that from the convenience of not having to work 9-5.
Zaphod
January 28, 2015
Replying to Joshua Kennon
Income inequality is real, we all know this. It is something to be concerned about for a couple reasons which you touched on. First, is how it undermines the whole concept of democracy and what our country is supposed to be about. In that regard I would prefer a common vote, as this should dilute a certain states importance and weight in the results, possibly even decreasing overall spending, definitely its uneven concentration. Now I havent thought it through deeply and tried to assess unintended consequences, etc... but on the face it makes sense.
Concentration of wealth at the top has led to unparalleled access to politicians, which has the effect (intended by those with the access) to take what may have been creation of wealth based on merit, grit, whatever, and turn that into maintenance of wealth/moat/etc...by fiat of policy. That's terrible, and kind of sadly where we are today (going by passed policies and rulings), essentially the institutionalization of inequality.
The second big problem becomes one of economics versus the human psyche. Due to the way our country creates gdp by consumerism its obvious to anyone who just thinks about it that we cant have all the wealth flow to fewer and fewer hands that do not make up for the purchasing power of the masses (otherwise they wouldnt be wealthy). This goes against the natural drive of most people/corporations to get the most they can for themselves, even if it is somewhat at someone else's expense. The whole smaller piece of an expanding pie vs. larger piece of stagnant/shrinking pie analogy. It would be bad if our current steady increase in inequality was starting to become more related to political influence than what you did for the world, social mobility, etc...that would be bad, in that I think it would lead to future that was less good than otherwise.
I agree that as long as standard of living increases above a certain level, then that is a fairly good thing being done. Im a fan of what I think of as thresholds (you only need to meet/just pass a certain level of income/wealth/appearance/compentency/intelligence/etc) in lots of areas of life (a mental model if you will), and it aplies there as well.
I dont think of it as fair, right, or deserving since these are just constructs and no one "deserves" anything, but that its literally just so doable, and the actual good to the overall world would be immense. Imagine the output, innovation, and advances we could get by what would be the collective super intelligence of bringing africa, asia, etc...into post industrialized eras all connected to the internet and enjoying a certain threshold of socioeconomic status. That would likely translate into an overall benefit to the world economy and future of humanity beyond what we can currently imagine. That is, a sadly large proportion of the earth is essentially disenfranchised, but we are also missing out on that immensely large potential they could be bringing in for everyone else as well. Long comment cut short, though seemingly altruistic/etc...I think bringing up the floor not only doesnt have to bring down the ceiling, but would improve it. We're simply not getting our full potential and have lots of growth ahead of us. Worst part of inequality may be that feeling that nothing matters and there is no drive if not born lucky, whether or not true, its bad for the economy to reduce participation. Sorry I've rambled on.
Andrew
January 31, 2015
Replying to Joshua Kennon
Could you imagine if everyone cared about eachother? How simple that would be. As simple, instantaneous and free as switching your perspective.
I wonder if caring is correlated with intelligence. I bet a civilization where everyone was friends would be extremely intelligent. It'd be a win-win-win across the board. We probably seem like rabid insects to them. I mean, we attack our own civilization. Isn't that embarrassing?
RapmasterD
January 30, 2015
Are there any updates to your post from a few years ago on the top one percent by wealth? Your figure from a few years ago was ~$5 million.....Thank you.
Michael
February 1, 2015
As an engineer and the son of doctors, I think that there is something to be said of the trappings of the occupation which results in very different levels of expenditures. If we all picture our model of a doctor, she will be wearing an expensive suit and shoes and maybe a Rolex time piece, she will drive a relatively new BMW or Mercedes and park it in her mansion’s 3 car garage, her children will attend private school and the family will take their nanny with them on ski trip and for vacation out of the country. Now think of an engineer, are you thinking of Dilbert? He is wearing a nondescript short sleeve shirt and a $70 calculator watch, he drives a 10-year old generic car to a 3 bedroom house, if he had children they would attend public schools and we would never expect him to ski or travel outside of the country except for to attend a technical conference which would be covered by his employer. Maintaining appearances for doctors is quite expense while engineers get off much more easily.
Of course these are stereotypes, I know a physician that is a fulltime missionary and engineers that are CEO, but one needs to have a story to explain deviations from our mental model for each occupation, otherwise we tend draw conclusions about their competency. If she were really any good at medicine she would have better shoes or what is he trying to cover up for by wearing an Armani suit. This is especially important for doctors who have numerous employers (patients) that must make judgments about the doctor’s competency in a very short period of time. Engineers typically work with the same group of people for years at a time and those people already know whether the engineer is competent regardless of the shine on his shoes or the stain on his shirt.
A complete separate factor relating to the income / wealth creation ratio, is the required amount of education. Most engineers emerge from university with a Bachelor of Science at 22 or 23 years old ready to work. Physicians require medical school, internship, and residency; it is common that they do not begin their career until their early thirties. During this extra 10 years of education and training with very limited earning, it is common for physicians to accumulate significant debt that will frequently be with them until their 40s.