The Federal Reserve 2013 data detailing changes in household wealth, income, and other statistics is now public and you can go here to download the spreadsheet files and other resources or read the 41-page summary detailing the changes over the past three years since the last survey was released [PDF].
Here is a paraphrased summary of some of the highlights from the report:
[mainbodyad]In the past 3 years, average family income rose by 4% inflation-adjusted but median family income declined 5% in real terms. That’s shocking. Meaning, if you are successful, you became more successful. Your salary is up, your dividends are up, your capital gains are up, your rents are up, more than offsetting the decline in your home value, but if you are an ordinary family, you have less purchasing power than you did as the bottom gets drug down by structural changes in the economy and the aftermath of the real estate bubble. We really are living through the equivalent of the Industrial Revolution. The hardest hit families were at the bottom, who are getting beat up pretty badly.
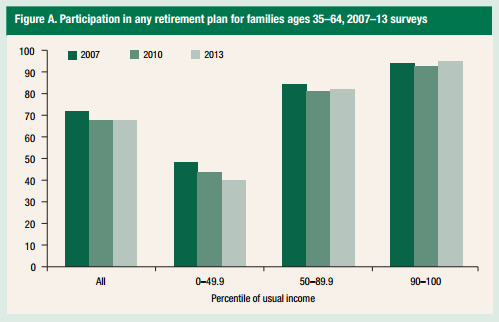
Ownership rates for businesses and homes fell substantially. Retirement plan participation fell. The bottom half of income cashed out of their holdings in a lot of cases, missing out on the subsequent gains.
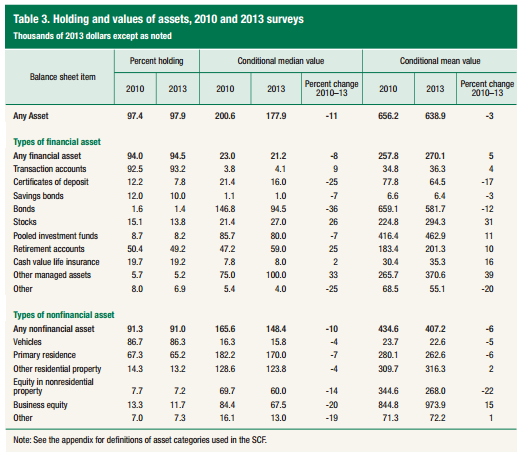
The good news? Debt has declined significantly. For families with debt, median debt declined by a shocking 20%, mean 13%. Debt burdens as measured by leverage ratios, debt-to-income ratios, and payment-to-income ratios also fell across the board. Families with payment-to-income ratios in excess of 40% are at the lowest level since before 2001. Those families carrying credit card debt decreased their median balances by 18% and mean balances by 25%, while the percentage of families opting to pay off their credit cards in full increased. Unfortunately, one debt type has gotten worse – student loan obligations – which are up “substantially” over the past three years.
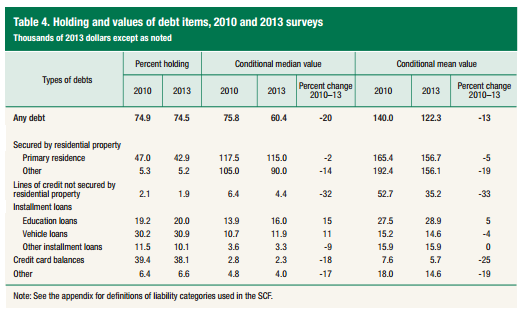
The median income for the top 10% of society – literally, 10 out of every 100 families – is now $223,200 per year. Those in the next highest group (the top 10% to 20% of society) had a median income of $121,700. It’s crazy, but if you think about what this means, we now live in a country where roughly 1 in 5 families is earning six-figures a year or more.
Meanwhile, the bottom 20% – the other 1 in 5 families – is earning a median income of $15,200. I still don’t even know how that is possible. I can’t wrap my head around it.
The data doesn’t show what is easily identifiable from other sources – that a lot of this is due to the near total collapse of marriage among the poor and assortative mating among the successful. To put it into perspective, single moms account for 25% of U.S. households, single dads an additional 6% on top of that; an exponential rise since 1960. When you lose the economies of scale of two adults under a single roof, splitting your income and assets across different properties with double fixed expenses, utilities, etc., it’s like getting caught in an undercurrent. You cannot evaluate this data in isolation without looking at what is causing it. It’s not politically correct to say, there are always exceptions (including two U.S. Presidents in the past few decades) but if you choose to have children out of wedlock and remain unmarried, your odds of living, and staying, in poverty are exponentially increased. It’s almost a sure-fire ticket to poor town. Wedding rings are the new status symbol, far more valuable than a Bentley. Solve the marriage crisis and a lot – not all, but a very good chunk – of the poverty resolves itself.
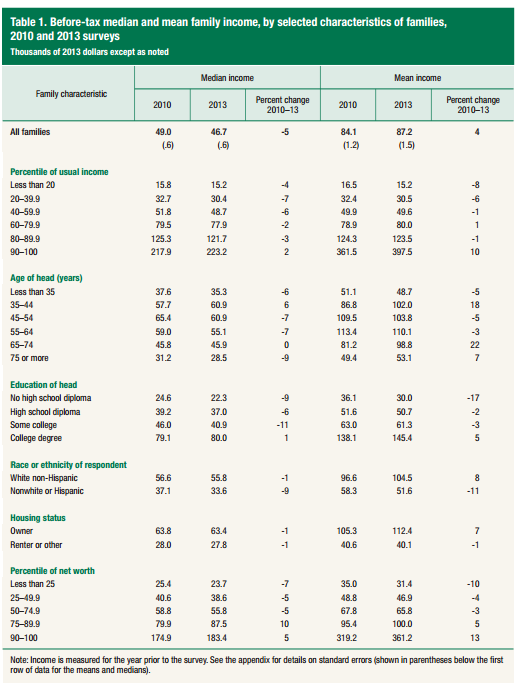
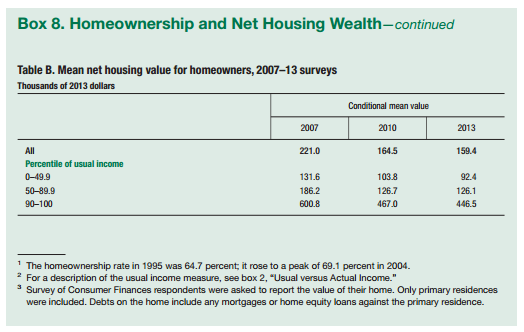
The median net worth of all families fell 2% to $81,200. The mean net worth remains the same at $534,600. Housing is to blame. People continued to fill in the hole created by the declining market value of their homes.
The numbers are just sickening to me. Almost everyone I know is earning way more money, with much higher net worths than they had three years ago. It feels like I live in a different universe. How can net worth be down for so many people since 2010? We literally just lived through one of the best possible environments for growing wealthy in the past 100 years. You could have been a complete idiot, had a low-paying job, and if you were even modestly frugal and had even a tiny bit of knowledge about valuations, seen that great companies were being given away for free. Real estate properties were being foreclosed. The only things that weren’t cheap were bonds and even they did well because they went into their own bubble driven by record low interest rates. This is just … unreal.
The decline in wages is one thing – cycles happen – but even if your income declines, your net worth should generally be going up with each passing year, adjusted for cyclical valuations in asset prices. If you earn $50,000 one year, $48,000 the next, and $46,000 the year after, you should still be richer at the end of year three than you were at the end of year one. After all, you brought in $144,000 during those 36 months. Some of it should have made it to the bottom line. If it’s not, and there isn’t a damn good reason (e.g., sudden medical crisis), you are running your estate very poorly.
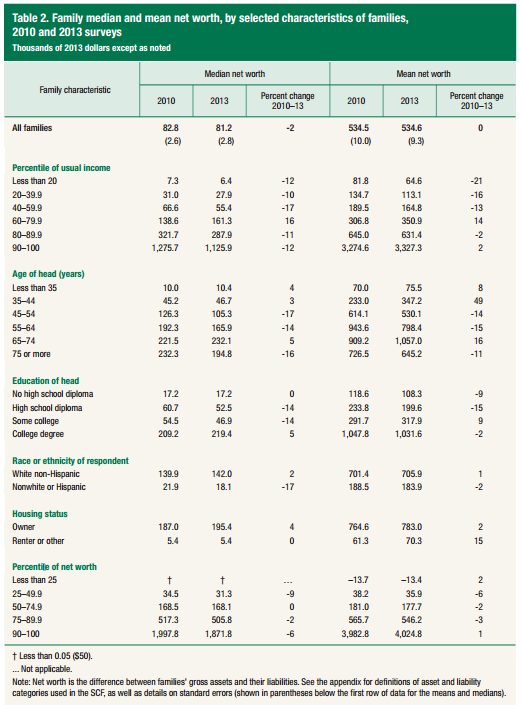
Here is the financial asset breakdown for families …
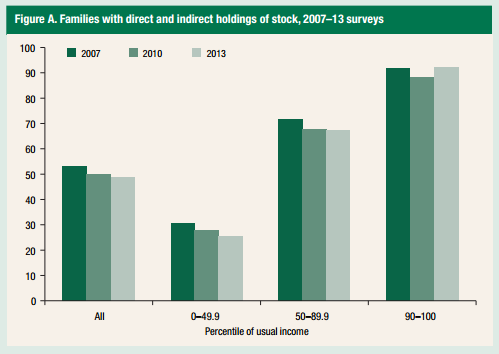
The families in the top 10% of income are far more likely than the typical American family to own shares of stock as an investment.
They are far more likely to participate in and fund a 401(k) or other retirement plan.
They are far more likely to own their own home, eschewing renting from someone else.
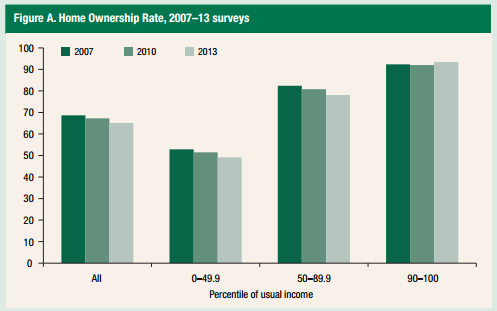
Really, again, a lot of it comes down to home values … bubbles are nasty, nasty things.
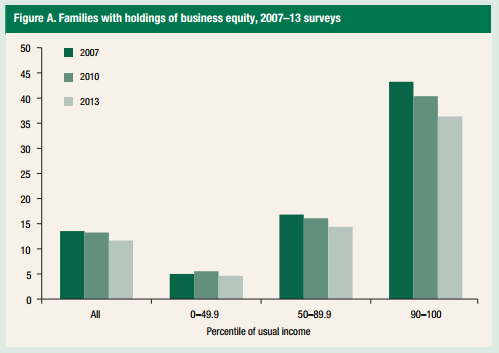
The top 10% are far more likely to hold ownership in a private operating business.
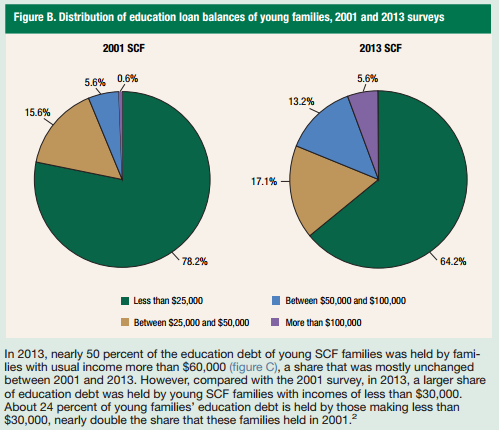
Here is a look at how education debt has changed over the past dozen or so years …
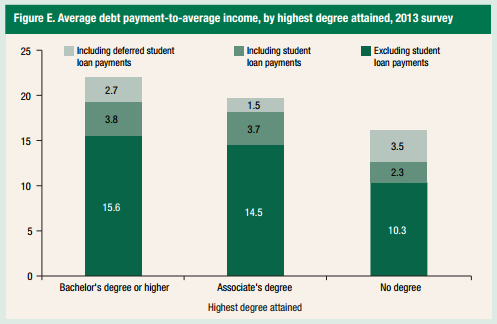
The amount of income devoted to debt repayment among recent college graduates is just horrifying …
Look at the debt ratios …
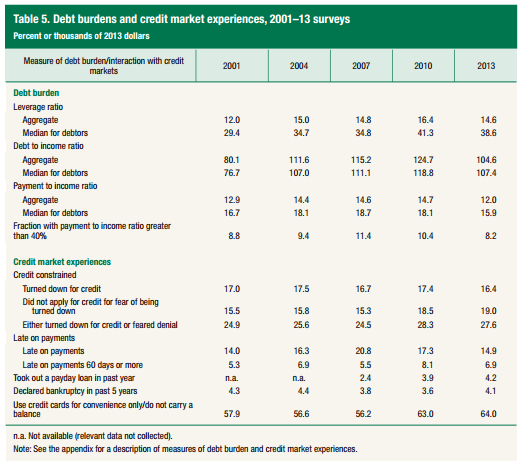
The payment to income ratio for the median household is 15.9%, which is much lower than it was in 2010. It looks scary, but it’s not quite as bad as it seems because a huge chunk of that is for mortgage debt, which is cheaper than renting on an opportunity cost basis if the valuation of the house was rational in the first place as measured by median household income to property value ratios. I still think it’s better for most people to live 100% debt free, though. If I were a guy working at a factory to support my family, I wouldn’t even have a mortgage on my house. I’d pay cash for used cars and be as frugal as possible to come up with any spare penny I could to buy commercial real estate or something to generate cash flow. Debt itself is often less than desirable, anyway, but it is especially toxic when used to fund non-cash generating assets. Just say no. Your life will be much better if you avoid the addiction, which is exactly what it becomes for most people. (I’m always amazed at people who say, “How can you survive without debt?” It’s a mathematically foolish argument. If you can’t afford $100, then you can’t afford $100 + interest. In some situations, you might end up paying 2 or 3 times the purchase price!) Do you realize how much easier life is when you aren’t paying rent on other peoples’ savings (which is all interest expense is – you’re literally renting the savings of other folks)? That’s all surplus purchasing power that now belongs to you and your family. It may require some painful times to get started but it snowballs into something really wonderful.
On the upshot, I suppose, if you are 35 years or younger, and have a net worth of more than $10,400, you are richer than half of all families in your age group. If you are 65-74, you need $232,100. For all families, again, it’s $81,200.
[mainbodyad]


