

How to Remain Detached from the Stock Market and Treat Your Investments Like Private Businesses
When I was much younger, I kept seeing Benjamin Graham’s famous allegory called Mr. Market mentioned by great economists, investors, and financial historians. I bought a copy of The Intelligent Investor to figure out why everyone was so enthralled with a book that was as old as my grandparents. It made so much sense that I immediately adjusted the way I managed my money and looked at my portfolio.
To this day, that approach remains in place because it has worked extraordinarily well. When the rest of the world was falling apart, I was standing there, checkbook in hand. When the rest of the world was overpriced, I avoided overpaying and getting drawn into the insanity. I have never lost a single hour of sleep over fluctuations in the stock market despite seeing enormous swings in quoted market value. To achieve this, I use a set of tools that work for me.
Specifically, I monitor my household investments through a set of spreadsheets that takes real time data from the stock market and updates the values in each field. This information is presented in a way that treats each equity ownership stake as an investment in a private company. I focus solely on my share of the net profit and the cash dividends that are distributed to me.
I’ll use a fictional scenario to illustrate.
Monitoring Your Portfolio As a Business Owner
Imagine you are a successful, middle-aged professional who has managed to build a collection of stocks with a market value of roughly $300,000. You still have a couple of decades until you and your spouse retire, so you are interested in accumulating wealth. You have no need for the money today, and plan on reinvesting your dividends, as well as adding fresh deposits of cash whenever you can afford to write a check.
If it were me, I would pull together the entire portfolio in a spreadsheet. I would then break down the positions by industry, so I could see where the investments were (you don’t want most of your money tied up in one area of the economy). I would program the spreadsheet to pull real-time data from the stock market so I could calculate my share of the after-tax net profits (my total shares owned multiplied by the earnings per share) and my share of the cash dividends. Whenever a company on the list updated its profit figure, the spreadsheet would change in real time.
Since it is often better to show rather than to tell, I went to the trouble of creating one. It is filled with a random list of companies that have no meaning – I just typed in company names I thought everyone would recognized around a few important industries and then plugged in a random share ownership figure. You can click the images to enlarge. You can also view the spreadsheet in Google Docs.
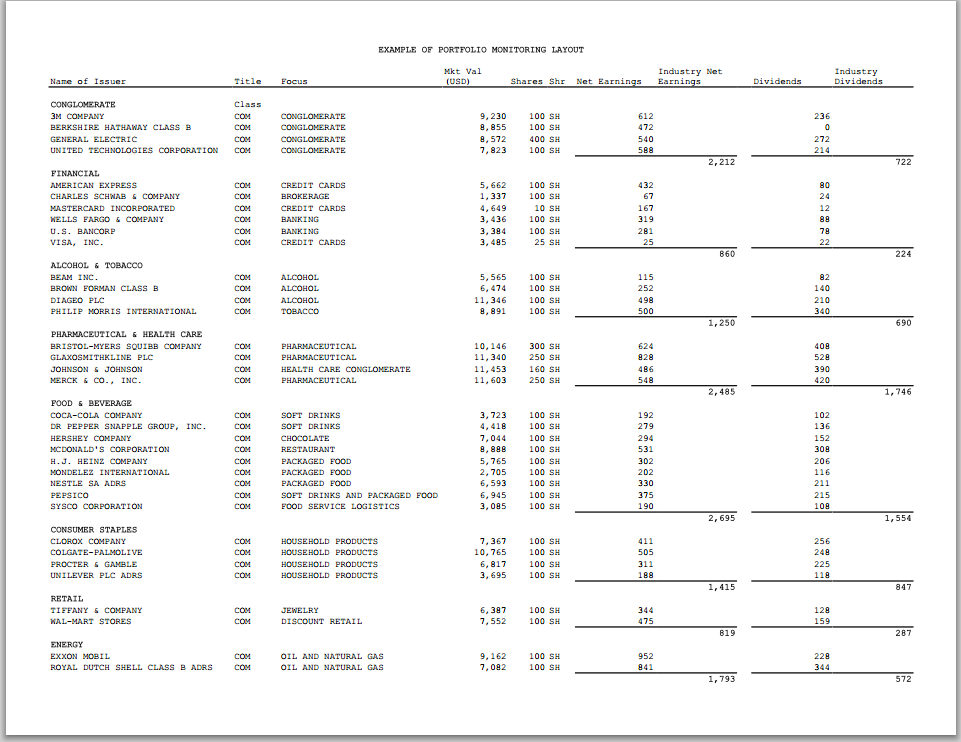
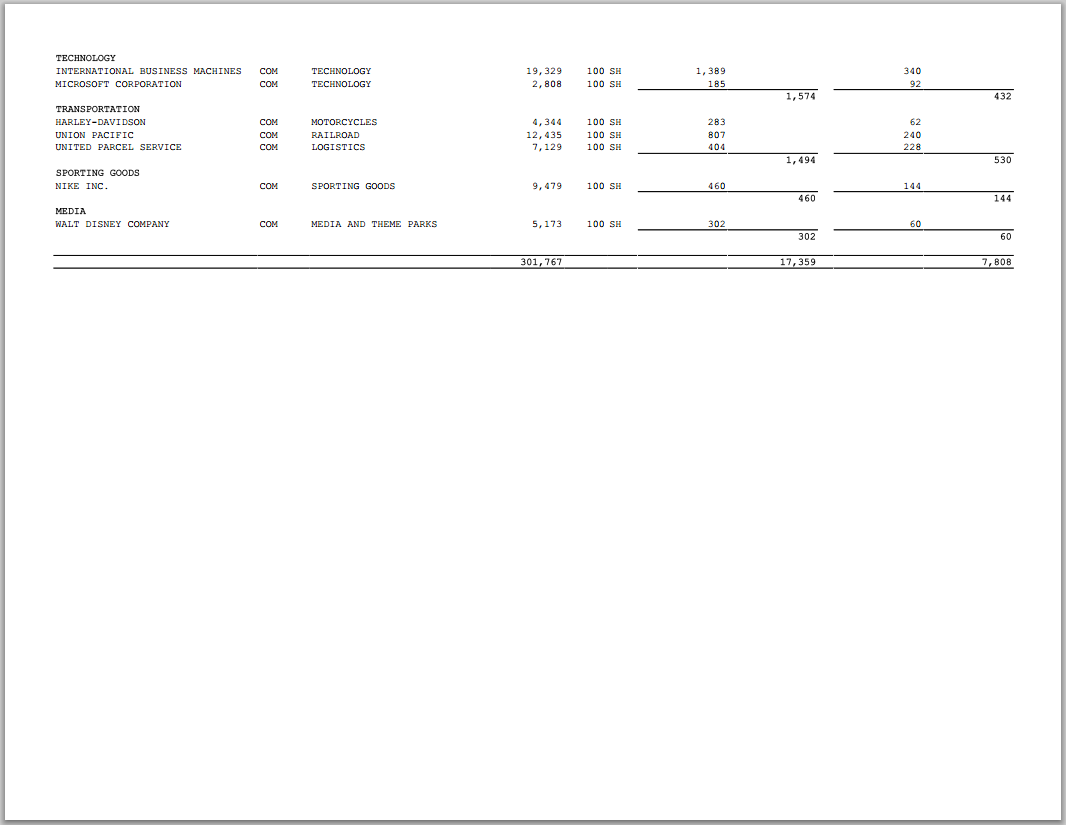
To me, the two most important lines on the spreadsheet are going to be at the bottom:
- The total net earnings, and
- The total cash dividends.
If you wanted to get richer, your job is to make those two figures grow as quickly as possible on a risk-adjusted basis. This can only happen in three ways:
- You write a check using fresh cash to acquire additional ownership
- You reinvest the dividends paid out by the companies, using the cash to acquire additional ownership
- The companies grow the earnings per share naturally over time as a result of expansion, stock buy backs, organic growth, price increases, and acquisitions. For example, in 25 years, without reinvesting dividends or adding any new cash, I would expect the net earnings of our fictional portfolio to be between $50,000 and $75,000, not the $17,359 it offers today.
That is it. Ultimately, your success depends on the price you pay for your ownership. The more you pay, the less you earn. The less you pay, the more you earn. Your task is to buy future profits. That does not mean you have to stick to stocks that have a rock bottom price-to-earnings ratio – after all, back in 1994, Starbucks would have been an absolute steal at 50x earnings because the underlying profits were growing so quickly.
The Portfolio Risk Checklist
Although this doesn’t cover everything, I would run down a risk checklist every time I reviewed my holdings:
- Are more than 10% of my net earnings coming a single company? If so, that could be a problem.
- Is more than 10% of my dividend income coming from a single company? If so, that could be a problem.
- Are more than 25% of my net earnings coming from a single industry? If so, that could be a problem.
- Is more than 25% of my dividend income coming from a single industry? If so, that could be a problem.
- Does my dividend income equal no more than 50% of my net earnings? If the figure is higher, that might indicate that the businesses I own are of low quality and in liquidation mode. It does not bode well for the future growth in the dividend stream if the dividend payout ratio is too high.
- Are my earnings and dividends growing much faster than inflation, on average, over the years? Both should be.
- Have any of my positions reached a point where the earnings yield is less than the yield on the 30-year Treasury bond? For example, the 100 shares of United Parcel Service generate $807 in look-through earnings, of which $228 is paid out in cash dividends. The market value of the position is $7,137. If I take $404 in profit and divide it into $7,137, I get 5.66%. Right now, the 30-Year Treasury bond is yielding 2.94%. The stock passes the test. (It may not be cheap enough I would want to buy more, but as a position that is already on the holding list, selling is often a mistake when you own a good company that has a strong market position. Also, there are a handful of times when this test doesn’t matter. Going back to the Starbucks example, if growth is high enough and the business small with rapid expansion in front of it, a low initial earnings yield may be entirely appropriate.)
- Perform the same calculation for the portfolio as a whole. If the earnings yield on the entire portfolio reached less than half the rate of the 30-Year Treasury, I’d seriously consider selling everything. This has only happened a few times in history at the top of bubbles. It would be better to sit parked in Treasury bonds in such a scenario. (We are a long way from that right now given the bond bubble we are witnessing. In the long-run, I think there is considerable evidence that those who acquire 30-Year Treasury bonds as buy-and-hold investments at today’s prices are going to be destroyed.) In any event, it is unlikely this would happen instantly. Rather, it is more probable that as individual positions became overvalued, they would be liquidated and put in better alternatives so there would be a shift over a period of months or years until the overall composition was still offering good returns.
- If the stock market closed for an extended period of time, as has happened throughout world history, and I couldn’t buy or sell any additional shares, would I sleep well at night knowing that these were the businesses in which I had an investment?
As long as I only paid rational prices for a stock when adding it to the portfolio, very little else really matters. My major task is to read the annual report and 10K disclosures each year to make sure management isn’t making dumb mistakes or reaching too far into the cookie jar.
Treat Building Wealth Like a Game
When you take this approach, accumulating money becomes a game. Your job is to think about the net earnings and dividend lines. If those figures get bigger year after year, you get richer in the long-run. It doesn’t matter what the stock market does in the short-term. You could wake up tomorrow and see your stocks down by half but all that means is you have the opportunity to buy more earnings and dividends for every dollar you spend to acquire new ownership.
I am speaking from personal experience. When I loaded my personal family investment holdings this morning, the first thing I noticed is that the net earnings figure increased across the portfolio as a result of the quarterly releases that are hitting Wall Street. My share of the profits grew because the companies I own are making more money. These figures were released, and the spreadsheet grabbed the new earnings per share figures and updated itself. Were this a collection of private businesses, I’d be thrilled. Profits are up. That bodes well for future dividend payouts and wealth.
Yet, at the same time, the overall market value of the portfolio fell by several percentage points as my fellow co-owners became upset with the short-term growth projections of major corporations such as Microsoft and McDonald’s. These are people interested in short-term capital gains, treating stocks like a penny slot machine. When there isn’t a quick payout, they get up and move to another machine. I’m not interested in that game. Not only is it a losing proposition in most circumstances, it’s intellectually boring. If you want an adrenaline rush, take up skydiving; don’t look to your portfolio. We’ve already talked about this, pointing out the considerable wealth you could have built in companies like Procter & Gamble, Colgate-Palmolive, Tiffany & Company, Coca-Cola, or Clorox, despite the fact that all of these businesses experienced drops of 30%, 40%, or even 50% or more in the short-term.
Final Thoughts on How to Think About Your Stock Investments
From time to time – typically once every decade – the economy will experience a terrible year in which most companies will have a big drop in profits or even post losses. This is normal. The best thing to do in most situations is to soldier on and focus on the long-term. After all, going back to the examples we just discussed – Procter & Gamble, Colgate-Palmolive, Tiffany & Company, Coca-Cola, and Clorox – all of those returns were generated in periods that included multiple wars, terrorist attacks, inflation, deflation, several bubbles, and rapid technological change.
Additionally, I like to maintain another set of spreadsheets that shows my cost basis for each position, the cumulative dividends that have been distributed (treating them as a cash rebate on the purchase price of the stock itself), and tracking any capital gains or losses on top of that figure. This is then compared to bond yields and the stock market as a whole.
Reader Comments (12)
Comments are presented chronologically, with replies indented beneath the comments to which they respond.
Kyle
October 22, 2012
Joshua,
Is there anyway you could share the spreadsheet for those of us who aren't familiar with pulling outside data into an excel document?
Joshua Kennon
October 22, 2012
Replying to Kyle
It depends on the program you use. If you are looking for something that is in the cloud and don't want to pay for a subscription to a professional service, Google Docs is great (other than you have to enter the dividend data by hand because it isn't a supported attribute). They published this page of explanation showing you how to pull in stock market attributes on their platform.
For example, if you wanted a cell to display the price of PepsiCo, you would enter GoogleFinance("PEP"; "price") as the cell value. Everything is explained on that linked sheet.
When you use Excel, it gets more complicated depending on which data set you are using.
Joshua Kennon
October 22, 2012
Replying to Kyle
Here is the link to the spreadsheet itself. I just had someone dump it into a blank Google doc and adapt it for you. I hope it was done right. Let me know if it worked for you.
Link to the Google spreadsheet
P.S. For some reason, the Google finance data set was showing the Class B earnings per share as equal to the Class A shares, when they should be 1/1500th the amount due to the ration between the two stock classes. I had the formula adjusted manually.
Lok
October 22, 2012
Hi Joshua,
Great article! And thanks for sharing your perspective and spreadsheet.
There's a typo on the $807 in look-through earnings figure. The correct figure is $404. It was a bit confusing, but I realised it was a typo, and made sense of it.
Thanks for the great article again. This probably sums up everything.
Joshua Kennon
October 22, 2012
Replying to Lok
Thanks! I'll try to remember to come back and correct that.
Joshua Kennon
October 23, 2012
Replying to Lok
Wait ... are you talking about Union Pacific? UNP has reported TTM EPS of $8.07 per share. Source (as of 10/23/2012 ... will be updated next quarterly earnings release and no longer equal that amount). A 100 share lot x $8.07 per share = $807 in earnings.
In the annual report, it was $6.72 for fiscal year 2011 on a diluted basis, but the real-time spreadsheet takes the trailing twelve months of earnings announcements to get the most accurate earnings figure.
The same goes for dividends. Technically, UNP's dividend last year was $1.93 per but the current dividend annualized rate is higher due to raises put in place by the board of directors.
If that's not what you are talking about please let me know so I can correct it! I want to make sure there isn't an error that could throw someone off when they are trying to make sense of the general layout.
Lok
October 24, 2012
Replying to Joshua Kennon
Joshua, nothing as complicated as that. Let me quote:
" For example, the 100 shares of United Parcel Service generate $807 in look-through earnings, of which $228 is paid out in cash dividends. The market value of the position is $7,137. If I take $404 in profit and divide it into $7,137, I get 5.66%."
Simply replace $807 with $404, then both sentences links up.
Michael Starke
October 23, 2012
So you have a 2D model (shares X eps, shares X dividend, shares X ask). Now how do you extrapolate into the time dimension? I realize that these dimensions are slowly changing (predominately quarterly), so do you just remember that data, or are your real spreadsheets a bit more complicated?
Joshua Kennon
October 23, 2012
Replying to Michael Starke
They are more complex. One of the other things I do is monitor the organic growth in total net earnings over time separately from the growth caused by fresh additions of cash and reinvested dividends, as well, to make sure capital added back to the principal doesn't hide non-satisfactory growth.
If you didn't want to invest a lot of time, one simple way to do it would be to archive the spreadsheet on the last day of every quarter, then hard-coding the final figures in so they didn't change. That way, you could actually look at your portfolio at four different snapshots throughout the year. Over a 5 or 10 year period, it would be very informative.
Adam J. Mead
October 24, 2012
Joshua, I was about to ask you about how you pull in the dividend info but it appears the question has already been asked and answered! Our fellow readers are great. I suppose manual entry isn't so bad when you're running a relatively concentrated portfolio either 🙂
Thanks for the articles, they're fantastic.
P.S. As a self-proclaimed excel-nerd I must say you make beautiful spreadsheets! Do you use Access for any of your data entry/storage?
Frank
July 25, 2013
After reading this post (and I know it's an old one), I decided to make my own spreadsheet. First route I took was taking the template from this site, then adjusted to my likings. Then I thought: "There should be other templates already out there" .. and sure enough!
Disclaimer: This spreadsheet is a modification of one created by Paul Zabin, but I modified it a bit here and ther, to my likings:
https://docs.google.com/spreadsheet/ccc?key=0AoIcpx-1jGvPdGx3ZEd4YmdqSUUybHlGZ1R6V2NfNkE&usp=sharing
This is my final design. Anyone can save it and adjust it how they wish, just give credit to Paul if you decide to share it. The original design by Paul is online, search for it on Google Docs templates.
Note: The stocks shown here are some stocks that I may be trading in the future. The list is not a suggestion on what you should be trading. Do your homework!
Note 2: You can save this to Excel, but you wont get any data, as is using Google Doc's API. You can modify your own Excel version.
Note 3: There are some hiddend columns: Some are intended to be hidden, others can be shown (i.e. Column B).
Enjoy everyone!
Cody A. Ray
April 1, 2015
These spreadsheet examples are super helpful! Keep 'em coming! 🙂