

Tiffany & Co.’s Valuation
A Five-Year Re-Examination of the Nation’s Premier Jewelry Store
Almost five years ago, Tiffany & Company was glittering at time when much of the corporate world was still mired in misery from devastating losses and the implosion of Wall Street. Based on the annual report for the prior year, 2010, worldwide net sales had risen by 12% on a constant-exchange-rate basis, reaching $3,085,290,000. After-tax profits were up 39% from the year before, 2009, when the developed world had gone through the worst meltdown since the Great Depression, coming in at $368,403,000. The net profit margin reached 11.9%. The dividend had been raised 47% after the board of directors hiked the payout on two separate occasions. In addition $81 million was spent repurchasing 1.8 million shares at what is, in retrospect, a significantly discounted price of $43.83. Short and long-term debt as a percentage of stockholders’ equity declined to 32%, strengthening an already impressive balance sheet. Return on equity reached 18%. Return on average assets increased to 10%. The total store count rose to 233, an increase of 13 net new stores over 2009 (1 store was closed in Japan, 5 new stores were opened in the Americas, 2 new stores were opened in Europe, and 7 new stores were opened in Asia-Pacific.)
 Management, in other words, had done a brilliant job navigating the economic crisis. Despite the volatility in the stock price, the business itself remained profitable even through the darkest nights of the maelstrom. Perhaps this was to be expected. After all, surviving recessions and depressions had been a part of Tiffany & Company’s cultural makeup going back to the earliest days of the firm when a then-25 year old Charles Louis Tiffany opened the doors to his store at 259 Broadway on September 18th, 1837. First day sales at his little emporium came to $4.95. Within six months, a catastrophic banking and real estate collapse occurred that led to the Panic of 1837, plunging the country headlong into a horrific recession that lasted six miserable years before finally abating in 1844. Decades, then centuries passed, the story repeating. There was the panic of 1873. The collapse of 1907. The decimation of 1929-1933. The 1973-1974 equity collapse. The period during which it was owned by Avon and damn near turned into a discount store. The 1987 implosion. The post-September 11th meltdown, and, most recently, the financial crisis of 2008-2009. Through it all, Tiffany & Co. stood, as solid as its now-legendary vault-like storefront, ringing up sales from blue boxes filled with diamonds and watches; selling sterling silver tea sets and gold charm bracelets; seducing with perfume and cut crystal vases, the brand equity reinforced by movies, television, magazines, and literature. Over the years, their master craftsmen have produced everything from fine china to stained-glass lamps that now sit in world-class museums and private collections. (Among my personal favorite: Tiffany & Company produced roughly 50, one-of-a-kind silver handguns back in 1880 to demonstrate American manufacturing superiority.)
By the time the end of the first quarter of 2011 approached, shares of Tiffany & Company were offering $2.87 in after-tax earnings, of which $1.16 was paid out as a cash dividend. Investors were willing to exchange their ownership of a single share for a price of $76.04. For the firm as a whole, it represented a market capitalization of $9.69 billion.
Despite my respect for the Tiffany & Company brand and my recognition that management was extraordinarily talented, I felt it was far too excessive for what you were getting in exchange. I wrote a post explaining my disagreement with the valuation in light of the other opportunities that were available at the time (consider that Wells Fargo & Company was still cheap; a far better bargain for long-term investors, as was Berkshire Hathaway). In essence, accepting what amounted to a 3.77% look-through earnings yield before any dividend taxes that would be owed if 100% of those earnings were distributed to owners required everything to go right. There was little to no margin of safety. Why should an investor commit new funds under those conditions? It was not a time to be opening your wallet.
Do you remember what I’ve taught you about an asset that becomes overvalued? Ultimately, regardless of what the price does in the short-term, intrinsic value acts like gravity, dragging everything around it into orbit. It’s a major part of the phenomenon known as “reverting to the mean” in equity prices. This means that the overvalued asset has two probable outcomes over the long-run:
- The asset treads water until the underlying earning power catches up to it
- The asset collapses in price, falling to a more reasonable ratio relative to earning power
Here we are, five years later, and Tiffany & Company shares have demonstrated the former. The high stock has bounced all over the place but ultimately held steady while the net profits per share kept growing. Bit by bit, year after year, the overvaluation burned off. Now, you have this interesting situation where, in early January of 2016, the shares are trading at within pennies of the price they were five years ago ($76.12 vs $76.04 in early January when I began writing this post*). Only, each share of ownership represents so much more than it did. Instead of 233 stores, you’re getting 305. Instead of $17.50 in book value, you’re getting $22.25. Instead of $2.87 in after-tax earnings, you’re getting $3.83. Instead of $1.16 in cash dividends, you’re getting $1.60.
 And all of that was achieved despite an incredibly painful, high-profile, bitter fight with the Swatch Group that ended in a nearly $300 million after-tax charge to earnings, wiping out almost an entire year of profits. The ruling was reversed on appeal but none of the money has, yet, been returned to the firm. (The situation is complex. If allegations are to be believed, the watchmaking powerhouse with which Tiffany & Company entered a 20-year agreement showed up with products that Tiffany’s management felt were not worthy of the brand name. The jeweler supposedly refused to market and support the sale of the watches, believing that its reputation was more important; that it should mean something if you spend four or five figures on a timepiece with their famous logo engraved on it and they weren’t going to do anything to cheapen the image people have of Tiffany & Company in their mind. As a result, it was found in breach of the agreement with a nearly $500 million pre-tax price tag. Tiffany took the hit and hired Nicola Andreatta, a “third-generation Swiss watch maker” to build an in-house luxury watch business from next to nothing, which you can read about in Fortune. They do not mess around with brand equity, which is one of the reasons the company is so appealing from an ownership perspective; they know the real source of return on capital; the thing that allows them to charge higher prices in addition to higher quality merchandise: Perception.)
It’s a familiar story for owners of the fine jeweler. Consider what a $10,000 investment in the Tiffany & Company IPO would be worth now with dividends reinvested according to the data Tiffany provides on its investor relations calculator.
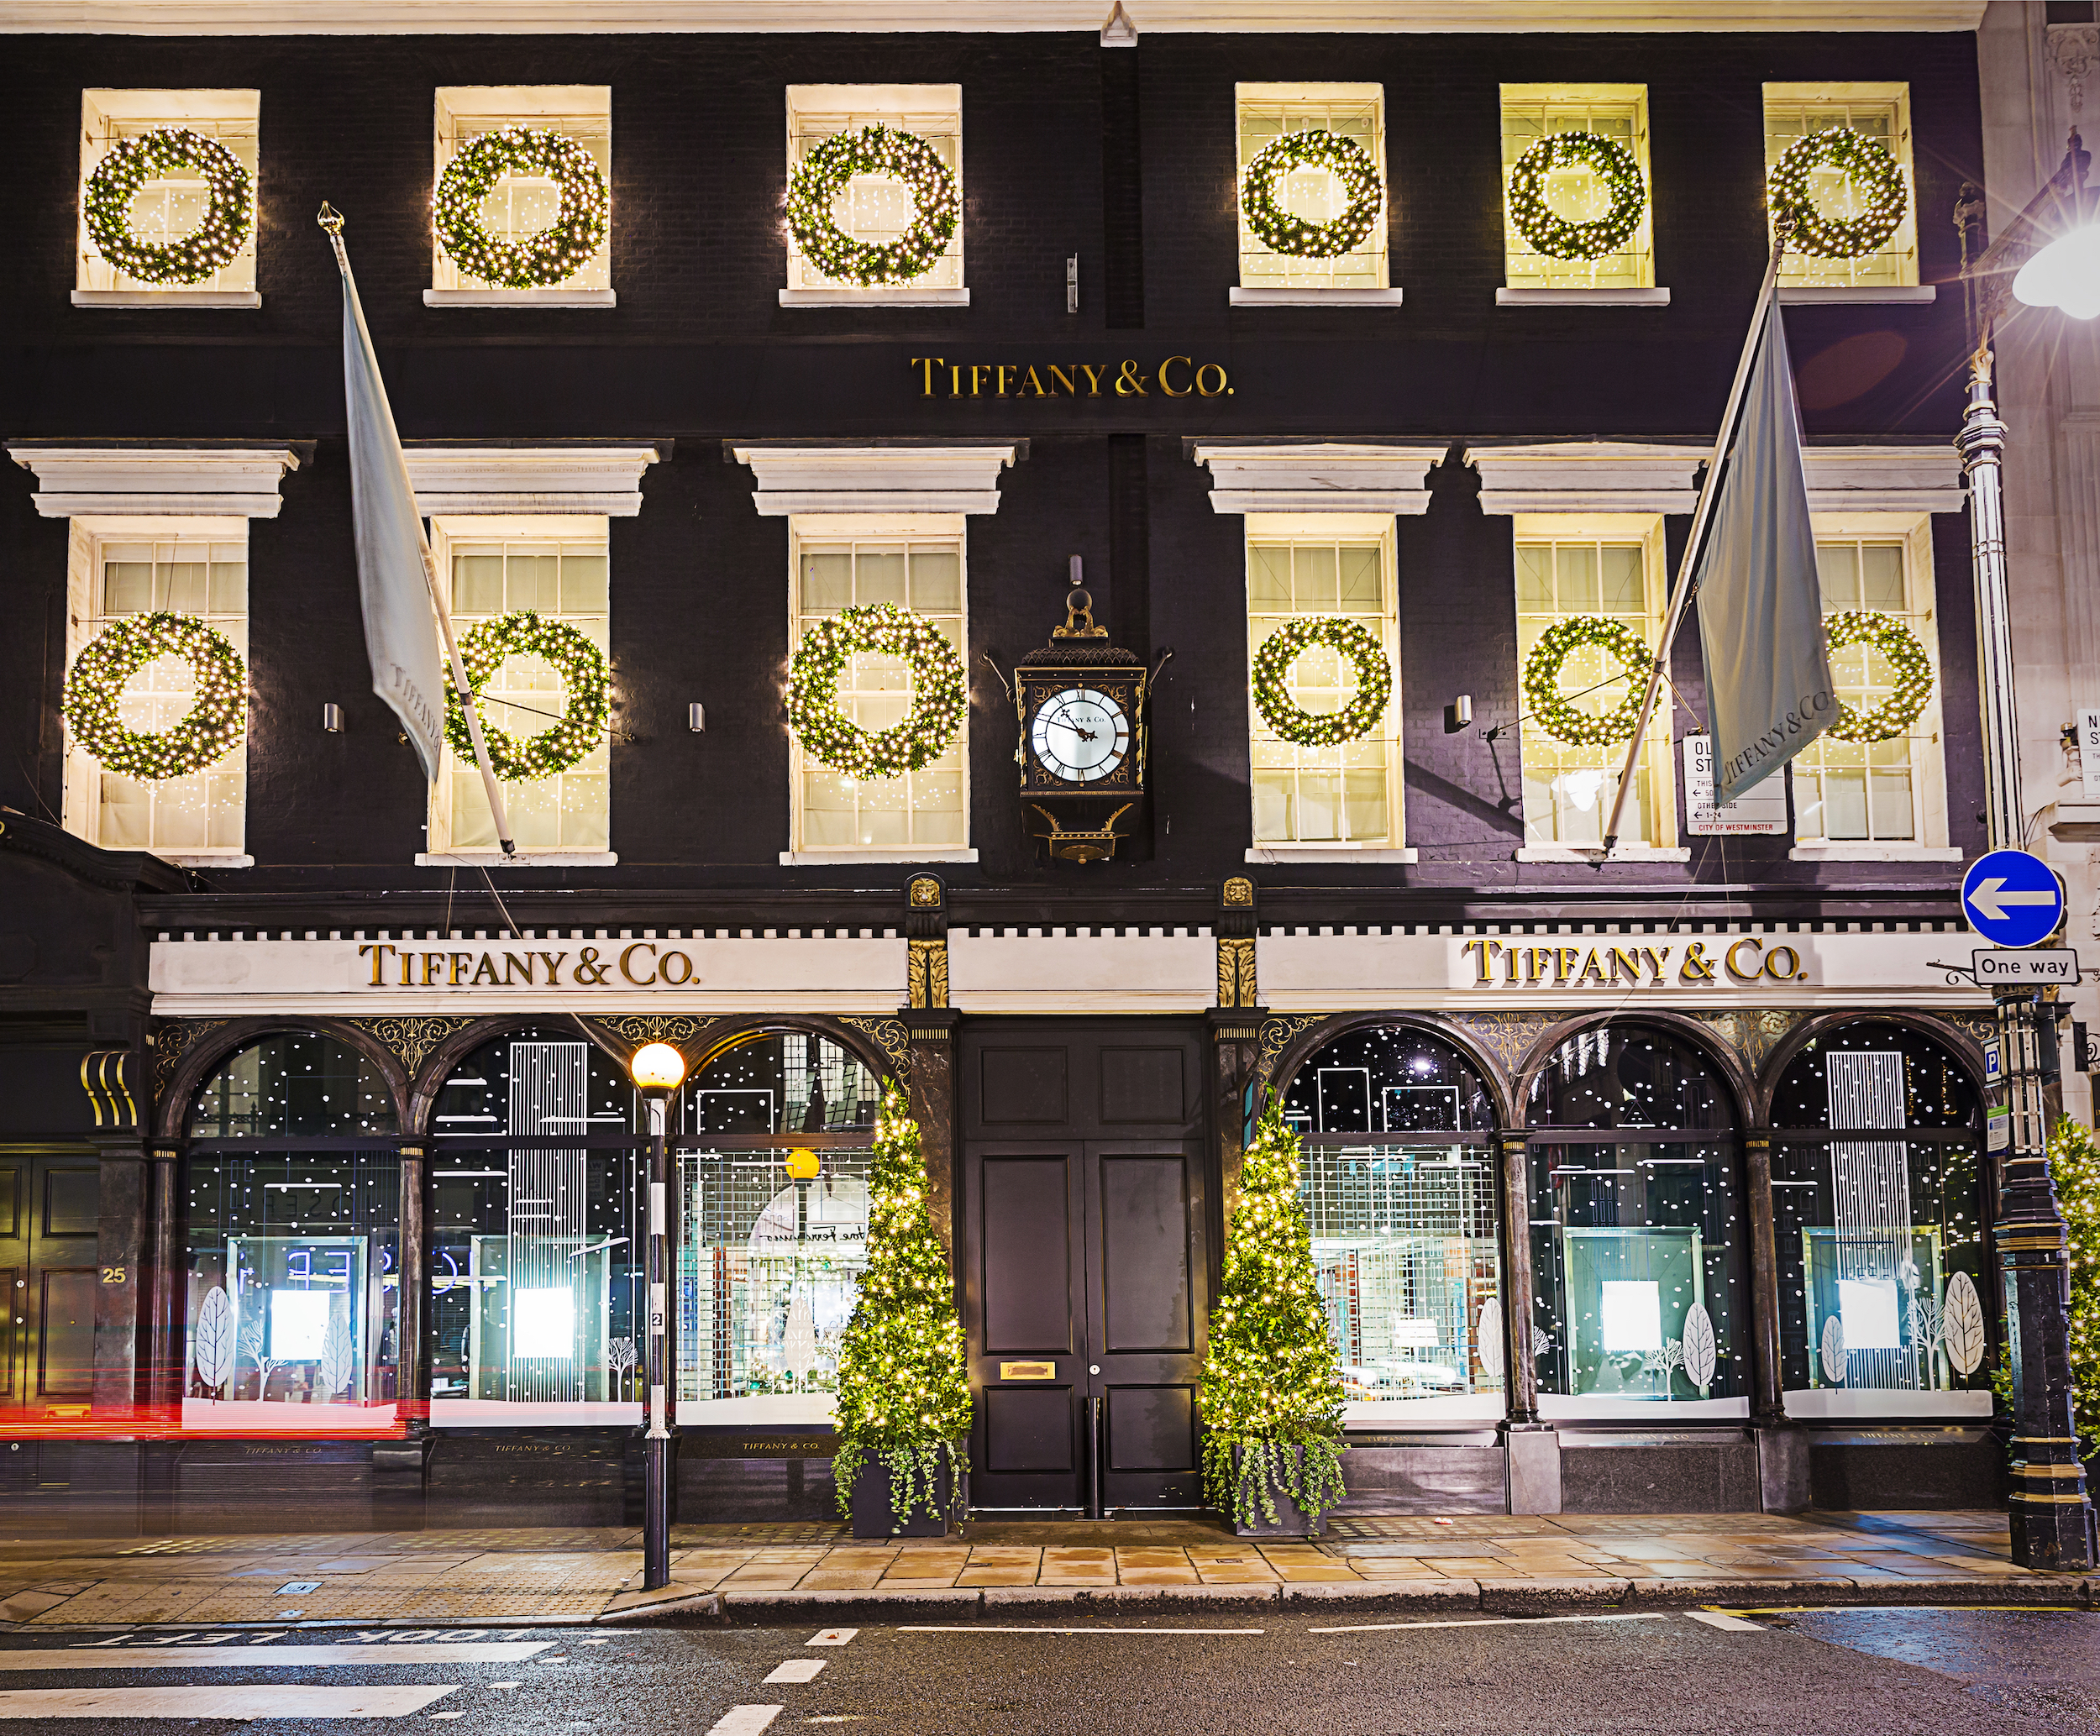
Editorial Credit: Anna Moskvina / Shutterstock.com
| DATE | REASON | FACTOR | SHARES | PRICE | VALUE | % |
|---|---|---|---|---|---|---|
| May 5, 1987 | Initial Investment | 434 | 23.00 | $9,982.00 | 0.00% | |
| Jun 14, 1988 | Dividend | 0.004 | 434 | 37.00 | $16,088.77 | 61.18% |
| Sep 14, 1988 | Dividend | 0.004 | 434 | 37.00 | $16,090.58 | 61.20% |
| Dec 14, 1988 | Dividend | 0.004 | 434 | 40.63 | $17,671.01 | 77.03% |
| Mar 14, 1989 | Dividend | 0.004 | 434 | 41.50 | $18,051.21 | 80.84% |
| Jun 14, 1989 | Dividend | 0.006 | 435 | 56.87 | $24,739.39 | 147.84% |
| Jul 17, 1989 | Dividend | 0.500 | 660 | 42.50 | $28,058.57 | 181.09% |
| Sep 14, 1989 | Dividend | 0.006 | 660 | 54.38 | $35,905.89 | 259.71% |
| Dec 14, 1989 | Dividend | 0.006 | 660 | 47.00 | $31,037.17 | 210.93% |
| Mar 14, 1990 | Dividend | 0.006 | 660 | 42.63 | $28,155.50 | 182.06% |
| Jun 14, 1990 | Dividend | 0.009 | 660 | 45.50 | $30,056.81 | 201.11% |
| Sep 14, 1990 | Dividend | 0.009 | 660 | 33.13 | $21,891.10 | 119.31% |
| Dec 14, 1990 | Dividend | 0.009 | 660 | 39.50 | $26,105.95 | 161.53% |
| Mar 14, 1991 | Dividend | 0.009 | 661 | 46.75 | $30,903.33 | 209.59% |
| Jun 14, 1991 | Dividend | 0.009 | 661 | 54.25 | $35,866.87 | 259.32% |
| Sep 16, 1991 | Dividend | 0.009 | 661 | 50.25 | $33,228.09 | 232.88% |
| Dec 16, 1991 | Dividend | 0.009 | 661 | 46.00 | $30,423.54 | 204.78% |
| Mar 16, 1992 | Dividend | 0.009 | 661 | 48.25 | $31,917.43 | 219.75% |
| Jun 15, 1992 | Dividend | 0.009 | 661 | 32.75 | $21,669.95 | 117.09% |
| Sep 15, 1992 | Dividend | 0.009 | 661 | 27.88 | $18,453.37 | 84.87% |
| Dec 14, 1992 | Dividend | 0.009 | 662 | 27.75 | $18,373.12 | 84.06% |
| Mar 15, 1993 | Dividend | 0.009 | 662 | 28.13 | $18,630.51 | 86.64% |
| Jun 14, 1993 | Dividend | 0.009 | 662 | 28.50 | $18,881.36 | 89.15% |
| Sep 14, 1993 | Dividend | 0.009 | 662 | 28.88 | $19,138.90 | 91.73% |
| Dec 14, 1993 | Dividend | 0.009 | 662 | 34.00 | $22,537.75 | 125.78% |
| Mar 15, 1994 | Dividend | 0.009 | 663 | 31.75 | $21,052.08 | 110.90% |
| Jun 14, 1994 | Dividend | 0.009 | 663 | 35.50 | $23,544.35 | 135.87% |
| Sep 14, 1994 | Dividend | 0.009 | 663 | 37.38 | $24,797.01 | 148.42% |
| Dec 14, 1994 | Dividend | 0.009 | 663 | 40.25 | $26,706.70 | 167.55% |
| Mar 15, 1995 | Dividend | 0.009 | 663 | 30.88 | $20,495.32 | 105.32% |
| Jun 16, 1995 | Dividend | 0.009 | 663 | 35.50 | $23,567.46 | 136.10% |
| Sep 18, 1995 | Dividend | 0.009 | 664 | 42.75 | $28,386.35 | 184.38% |
| Dec 18, 1995 | Dividend | 0.009 | 664 | 51.25 | $34,036.23 | 240.98% |
| Mar 18, 1996 | Dividend | 0.009 | 664 | 53.75 | $35,702.34 | 257.67% |
| Jun 26, 1996 | Dividend | 0.013 | 664 | 69.38 | $46,092.55 | 361.76% |
| Jul 24, 1996 | Stock Split | 1,328 | 32.00 | $42,518.35 | 325.95% | |
| Sep 18, 1996 | Dividend | 0.013 | 1,329 | 39.50 | $52,500.20 | 425.95% |
| Dec 18, 1996 | Dividend | 0.013 | 1,329 | 34.00 | $45,206.66 | 352.88% |
| Mar 18, 1997 | Dividend | 0.013 | 1,330 | 41.00 | $54,530.54 | 446.29% |
| Jun 18, 1997 | Dividend | 0.018 | 1,330 | 47.63 | $63,371.80 | 534.86% |
| Sep 17, 1997 | Dividend | 0.018 | 1,331 | 46.19 | $61,479.16 | 515.90% |
| Dec 18, 1997 | Dividend | 0.018 | 1,331 | 37.06 | $49,350.37 | 394.39% |
| Mar 18, 1998 | Dividend | 0.018 | 1,332 | 49.19 | $65,526.40 | 556.45% |
| Jun 17, 1998 | Dividend | 0.023 | 1,332 | 42.63 | $56,817.74 | 469.20% |
| Sep 17, 1998 | Dividend | 0.023 | 1,333 | 36.81 | $49,090.77 | 391.79% |
| Dec 17, 1998 | Dividend | 0.023 | 1,334 | 41.44 | $55,295.47 | 453.95% |
| Mar 18, 1999 | Dividend | 0.023 | 1,334 | 72.00 | $96,103.23 | 862.77% |
| Jun 21, 1999 | Dividend | 0.120 | 1,337 | 88.38 | $118,166.99 | 1,083.80% |
| Jun 21, 1999 | Dividend | 0.030 | 1,337 | 88.38 | $118,166.99 | 1,083.80% |
| Jul 22, 1999 | Stock Split | 2,674 | 50.88 | $136,056.49 | 1,263.02% | |
| Sep 16, 1999 | Dividend | 0.030 | 2,675 | 60.88 | $162,877.39 | 1,531.71% |
| Dec 16, 1999 | Dividend | 0.030 | 2,676 | 81.69 | $218,632.40 | 2,090.27% |
| Mar 16, 2000 | Dividend | 0.030 | 2,677 | 79.56 | $213,012.02 | 2,033.96% |
| Jun 16, 2000 | Dividend | 0.040 | 2,679 | 62.06 | $166,265.04 | 1,565.65% |
| Jul 21, 2000 | Stock Split | 5,358 | 36.44 | $195,252.91 | 1,856.05% | |
| Sep 18, 2000 | Dividend | 0.040 | 5,363 | 39.63 | $212,559.94 | 2,029.43% |
| Dec 18, 2000 | Dividend | 0.040 | 5,370 | 30.63 | $164,502.01 | 1,547.99% |
| Mar 16, 2001 | Dividend | 0.040 | 5,378 | 28.69 | $154,297.83 | 1,445.76% |
| Jun 18, 2001 | Dividend | 0.040 | 5,384 | 33.53 | $180,542.99 | 1,708.69% |
| Sep 18, 2001 | Dividend | 0.040 | 5,394 | 22.25 | $120,020.97 | 1,102.37% |
| Dec 18, 2001 | Dividend | 0.040 | 5,401 | 28.00 | $151,253.40 | 1,415.26% |
| Mar 18, 2002 | Dividend | 0.040 | 5,407 | 37.01 | $200,140.66 | 1,905.02% |
| Jun 18, 2002 | Dividend | 0.040 | 5,413 | 37.01 | $200,356.96 | 1,907.18% |
| Sep 18, 2002 | Dividend | 0.040 | 5,422 | 25.00 | $135,556.29 | 1,258.01% |
| Dec 18, 2002 | Dividend | 0.040 | 5,430 | 25.06 | $136,098.52 | 1,263.44% |
| Mar 18, 2003 | Dividend | 0.040 | 5,439 | 26.20 | $142,506.99 | 1,327.64% |
| Jun 18, 2003 | Dividend | 0.050 | 5,447 | 32.97 | $179,602.32 | 1,699.26% |
| Sep 18, 2003 | Dividend | 0.050 | 5,454 | 39.66 | $216,318.11 | 2,067.08% |
| Dec 17, 2003 | Dividend | 0.050 | 5,460 | 42.81 | $233,771.91 | 2,241.93% |
| Mar 17, 2004 | Dividend | 0.050 | 5,467 | 38.64 | $211,273.89 | 2,016.55% |
| Jun 17, 2004 | Dividend | 0.060 | 5,476 | 37.08 | $203,072.27 | 1,934.38% |
| Sep 16, 2004 | Dividend | 0.060 | 5,486 | 32.06 | $175,908.34 | 1,662.26% |
| Dec 16, 2004 | Dividend | 0.060 | 5,497 | 30.95 | $170,147.15 | 1,604.54% |
| Mar 17, 2005 | Dividend | 0.060 | 5,507 | 31.82 | $175,259.81 | 1,655.76% |
| Jun 16, 2005 | Dividend | 0.080 | 5,521 | 32.92 | $181,759.07 | 1,720.87% |
| Sep 16, 2005 | Dividend | 0.080 | 5,532 | 37.76 | $208,923.55 | 1,993.00% |
| Dec 16, 2005 | Dividend | 0.080 | 5,544 | 39.17 | $217,167.62 | 2,075.59% |
| Mar 16, 2006 | Dividend | 0.080 | 5,555 | 39.10 | $217,223.07 | 2,076.15% |
| Jun 16, 2006 | Dividend | 0.100 | 5,572 | 33.25 | $185,278.50 | 1,756.13% |
| Sep 18, 2006 | Dividend | 0.100 | 5,588 | 33.50 | $187,228.80 | 1,775.66% |
| Dec 18, 2006 | Dividend | 0.100 | 5,603 | 37.89 | $212,323.04 | 2,027.06% |
| Mar 16, 2007 | Dividend | 0.100 | 5,616 | 42.71 | $239,893.10 | 2,303.26% |
| Jun 18, 2007 | Dividend | 0.120 | 5,630 | 48.90 | $275,335.05 | 2,658.32% |
| Sep 18, 2007 | Dividend | 0.150 | 5,646 | 53.95 | $304,614.03 | 2,951.63% |
| Dec 18, 2007 | Dividend | 0.150 | 5,664 | 46.87 | $265,485.66 | 2,559.64% |
| Mar 18, 2008 | Dividend | 0.150 | 5,687 | 36.44 | $207,256.68 | 1,976.30% |
| Jun 18, 2008 | Dividend | 0.170 | 5,708 | 46.34 | $264,530.95 | 2,550.08% |
| Sep 18, 2008 | Dividend | 0.170 | 5,733 | 38.22 | $219,148.54 | 2,095.44% |
| Dec 18, 2008 | Dividend | 0.170 | 5,773 | 24.72 | $142,716.04 | 1,329.73% |
| Mar 18, 2009 | Dividend | 0.170 | 5,819 | 21.14 | $123,029.08 | 1,132.51% |
| Jun 18, 2009 | Dividend | 0.170 | 5,858 | 25.73 | $150,730.99 | 1,410.03% |
| Sep 17, 2009 | Dividend | 0.170 | 5,883 | 38.82 | $228,410.47 | 2,188.22% |
| Dec 17, 2009 | Dividend | 0.170 | 5,907 | 42.41 | $250,533.69 | 2,409.85% |
| Mar 18, 2010 | Dividend | 0.200 | 5,932 | 47.58 | $282,256.54 | 2,727.66% |
| Jun 17, 2010 | Dividend | 0.250 | 5,966 | 43.79 | $261,256.37 | 2,517.27% |
| Sep 16, 2010 | Dividend | 0.250 | 5,999 | 44.42 | $266,506.55 | 2,569.87% |
| Dec 16, 2010 | Dividend | 0.250 | 6,022 | 64.61 | $389,140.36 | 3,798.42% |
| Mar 17, 2011 | Dividend | 0.250 | 6,049 | 56.67 | $342,824.17 | 3,334.42% |
| Jun 16, 2011 | Dividend | 0.290 | 6,073 | 72.71 | $441,612.22 | 4,324.09% |
| Sep 16, 2011 | Dividend | 0.290 | 6,097 | 75.00 | $457,282.13 | 4,481.07% |
| Dec 16, 2011 | Dividend | 0.290 | 6,125 | 62.61 | $383,507.28 | 3,741.99% |
| Mar 16, 2012 | Dividend | 0.290 | 6,151 | 68.03 | $418,482.95 | 4,092.38% |
| Jun 18, 2012 | Dividend | 0.320 | 6,188 | 53.75 | $332,608.75 | 3,232.09% |
| Sep 18, 2012 | Dividend | 0.320 | 6,218 | 64.08 | $398,511.69 | 3,892.30% |
| Dec 18, 2012 | Dividend | 0.320 | 6,252 | 59.87 | $374,319.89 | 3,649.95% |
| Mar 18, 2013 | Dividend | 0.320 | 6,281 | 68.83 | $432,340.41 | 4,231.20% |
| Jun 18, 2013 | Dividend | 0.340 | 6,309 | 76.59 | $483,218.77 | 4,740.90% |
| Sep 18, 2013 | Dividend | 0.340 | 6,335 | 80.29 | $508,707.78 | 4,996.25% |
| Dec 18, 2013 | Dividend | 0.340 | 6,359 | 91.47 | $581,697.12 | 5,727.46% |
| Mar 18, 2014 | Dividend | 0.340 | 6,382 | 92.67 | $591,490.64 | 5,825.57% |
| Jun 18, 2014 | Dividend | 0.380 | 6,407 | 99.90 | $640,063.47 | 6,312.18% |
| Sep 18, 2014 | Dividend | 0.380 | 6,431 | 99.99 | $643,074.78 | 6,342.34% |
| Dec 18, 2014 | Dividend | 0.380 | 6,454 | 103.62 | $668,864.66 | 6,600.71% |
| Mar 18, 2015 | Dividend | 0.380 | 6,483 | 85.45 | $554,030.62 | 5,450.30% |
| Jun 18, 2015 | Dividend | 0.400 | 6,511 | 93.15 | $606,548.45 | 5,976.42% |
| Sep 17, 2015 | Dividend | 0.400 | 6,543 | 80.61 | $527,498.55 | 5,184.50% |
| Dec 17, 2015 | Dividend | 0.400 | 6,579 | 73.23 | $481,822.58 | 4,726.91% |
| Dec 31, 2015 | Current Investment | 6,579 | 76.29 | $501,956.09 | 4,928.61% | |
That chart is demonstrative of a key concept I try to reiterate all the time: If you have a good business, with real profits, and you pay a reasonable price relative to those earnings, it eventually shows up in your net worth. Add diversification to make up for any “breakage” (e.g., you get bought out during a market collapse and thus lose the opportunity to participate in recovery) you realize how simple the whole thing is. It would have been a mistake to try and buy and sell Tiffany & Company rapidly, trading its shares as if they were cheap baubles. As the earnings kept marching toward the sun, you should have guarded them, refusing to part ways no matter what the stock market was doing at the time precisely as you would if you’d owned 100% of the place. There was a 5-year period in the late 1980s and early 1990s when the shares collapsed by 50%, the same way shares of The Hershey Company do from time to time. Trying to avoid this sort of thing is a fool’s errand. It’s a waste of energy if you managed to get the purchase price right.
 An even more extreme illustration: Your shares were worth $213,012.02 in March of 2000 at the height of the dot-com bubble and, nine long years later, a mere $123,029.08 at the depth of the Great Recession. Nearly a decade of waiting had resulted in 42.2% losses. Of course, you could have mitigated these were you dollar cost averaging your way into more ownership over time, the highs and lows averaging each other out nicely to some degree, but that pain on paper was still very, very real. Let the magnitude sink in for a moment. Nine years for 42.2% losses on paper. The culprit: Extreme levels of overvaluation at the start of the period. On 1999 earnings of $1.95 per share, the stock was going for $79.56. It was an earnings yield of 2.45% compared to the 10-year Treasury yield of 6.26% that same day. In other words, for taking practically no risk and parking your money in the sovereign debt of the United States, you were guaranteed a base return of at 256% more money. With the valuation multiple already elevated to extremely high levels, Tiffany & Company would have had to grow to the moon in a short span of time to be fairly appraised at that price.
Here we are, 29 years after that IPO and none of it mattered because mean reversion relative to intrinsic value cannot be escaped indefinitely. Despite those horrifically painful periods, you’ve compounded your money at an incredible 14.4%+ per annum; from a firm that everyone, their mother, grandmother, great-grandmother, great, great grandmother, and great, great great grandmother knows. Even better, the ending multiple relative to growth is sane. A strong argument can be made that the shares are much more reasonably valued for a long-term owner at today’s price, even if we were to go into a recession tomorrow. In our case, that’s not merely an academic opinion. Aaron and I, along with members of our family, have picked up shares for our own long-term portfolios recently, though I’d start to get really serious about it compared to everything else on my desk if it were to get down into the $50’s or lower. If you discover the shares at 50¢ on the dollar a few years from now, don’t cry for us. We’re almost assuredly still sitting on our equity and, all else equal, probably writing more checks.

Tiffany & Company was one of the first jewelers in the United States to celebrate marriage equality, launching an advertising campaign around a real-life couple in its home market of New York City. If you go into the Kansas City boutique today, there’s a section featuring men’s rings with that couple’s picture prominently displayed next to them. It meant a lot to Aaron and me, both as shareholders and customers (our own wedding rings are from Tiffany).
Why am I telling you all of this? To remind you of something that doesn’t receive enough focus in universities, on the Internet, or during face-to-face conversations among investors: The price you pay ultimately matters a great deal more than almost any other variable (the return on capital employed by the underlying business being a close second – if you’re dealing with a top-shelf asset, a bit of overvaluation is probably not going to make much difference in the long-run). There is a price so high, if you pay it, you’re screwed. To a point (presently ignoring things like environmental liabilities or other exposures that could cause something to have a negative value, turning it into a liability), no matter how bad the asset is, there is a price so low that, if you pay it, you could have a good outcome. The moment you write the check and your transaction is recorded, the die is cast. There’s no going back because that is the relative point against which everything else will be measured. The same company, the same assets, the same employees, the same profits; different purchase price, wildly different outcomes result based on that purchase price. The old retail adage, “Well bought is well sold” is particularly appropriate. Make a list of the generational holdings you want to acquire and then watch them like a sniper lining up a target. It may take years, perhaps even a decade or more, but sooner or later, you very well may get your price.
Is Tiffany & Company a steal? No. But I wouldn’t think it a mathematically foolish suggestion that a 1% to 3% portfolio weighting, acquired at today’s prices, held with dividends reinvested and ignored for the next 25 years, has a higher-than average probability of a satisfactory outcome that would cause the owner to look back with a lot of joy and fondness on the decision. It’s a far different situation than four years ago when the earnings and growth projections didn’t justify the price. Once attained, extreme passivity seems the most intelligent course of action. While I can’t offer any guarantees, I’m willing to wager that if you get back to me in January of 2041, assuming we’re both still fortunate enough to be alive, you’ll see that I was right.
*Update: Sometimes, you really do get a burst of good luck seemingly out of nowhere. Within 72 hours of publishing this, fortune began smiling upon value investors as the Chinese implosion caused equity prices to tank. In the contagion, Tiffany & Company shares fell another ~10%, hitting a new 52-week low. I had two family members pick up shares earlier today (Friday, January 8th, 2016), both paying in the $60s. As I mentioned in this post, I keep hoping we see the $50s or lower (stranger things have happened; back during the 2009 period we discussed, there was an ephemeral moment when the shares hit the high teens) because it would cause me to seriously look at making a substantial commitment given what I’d be receiving relative to the core economic engine. Nevertheless, it’s foolish to put off what I consider a demonstrably fair long-term purchase today for the hope of an extremely favorable, less probable price tomorrow. When and if that cheaper price ever arrives, I’ll take advantage of it from cash flow and cash reserves. If it does materialize, whether or not I mention our activities on this blog, you can probably guess what I’ve been doing if you spot me walking around Kansas City humming “Diamonds are a girl’s best friend”.
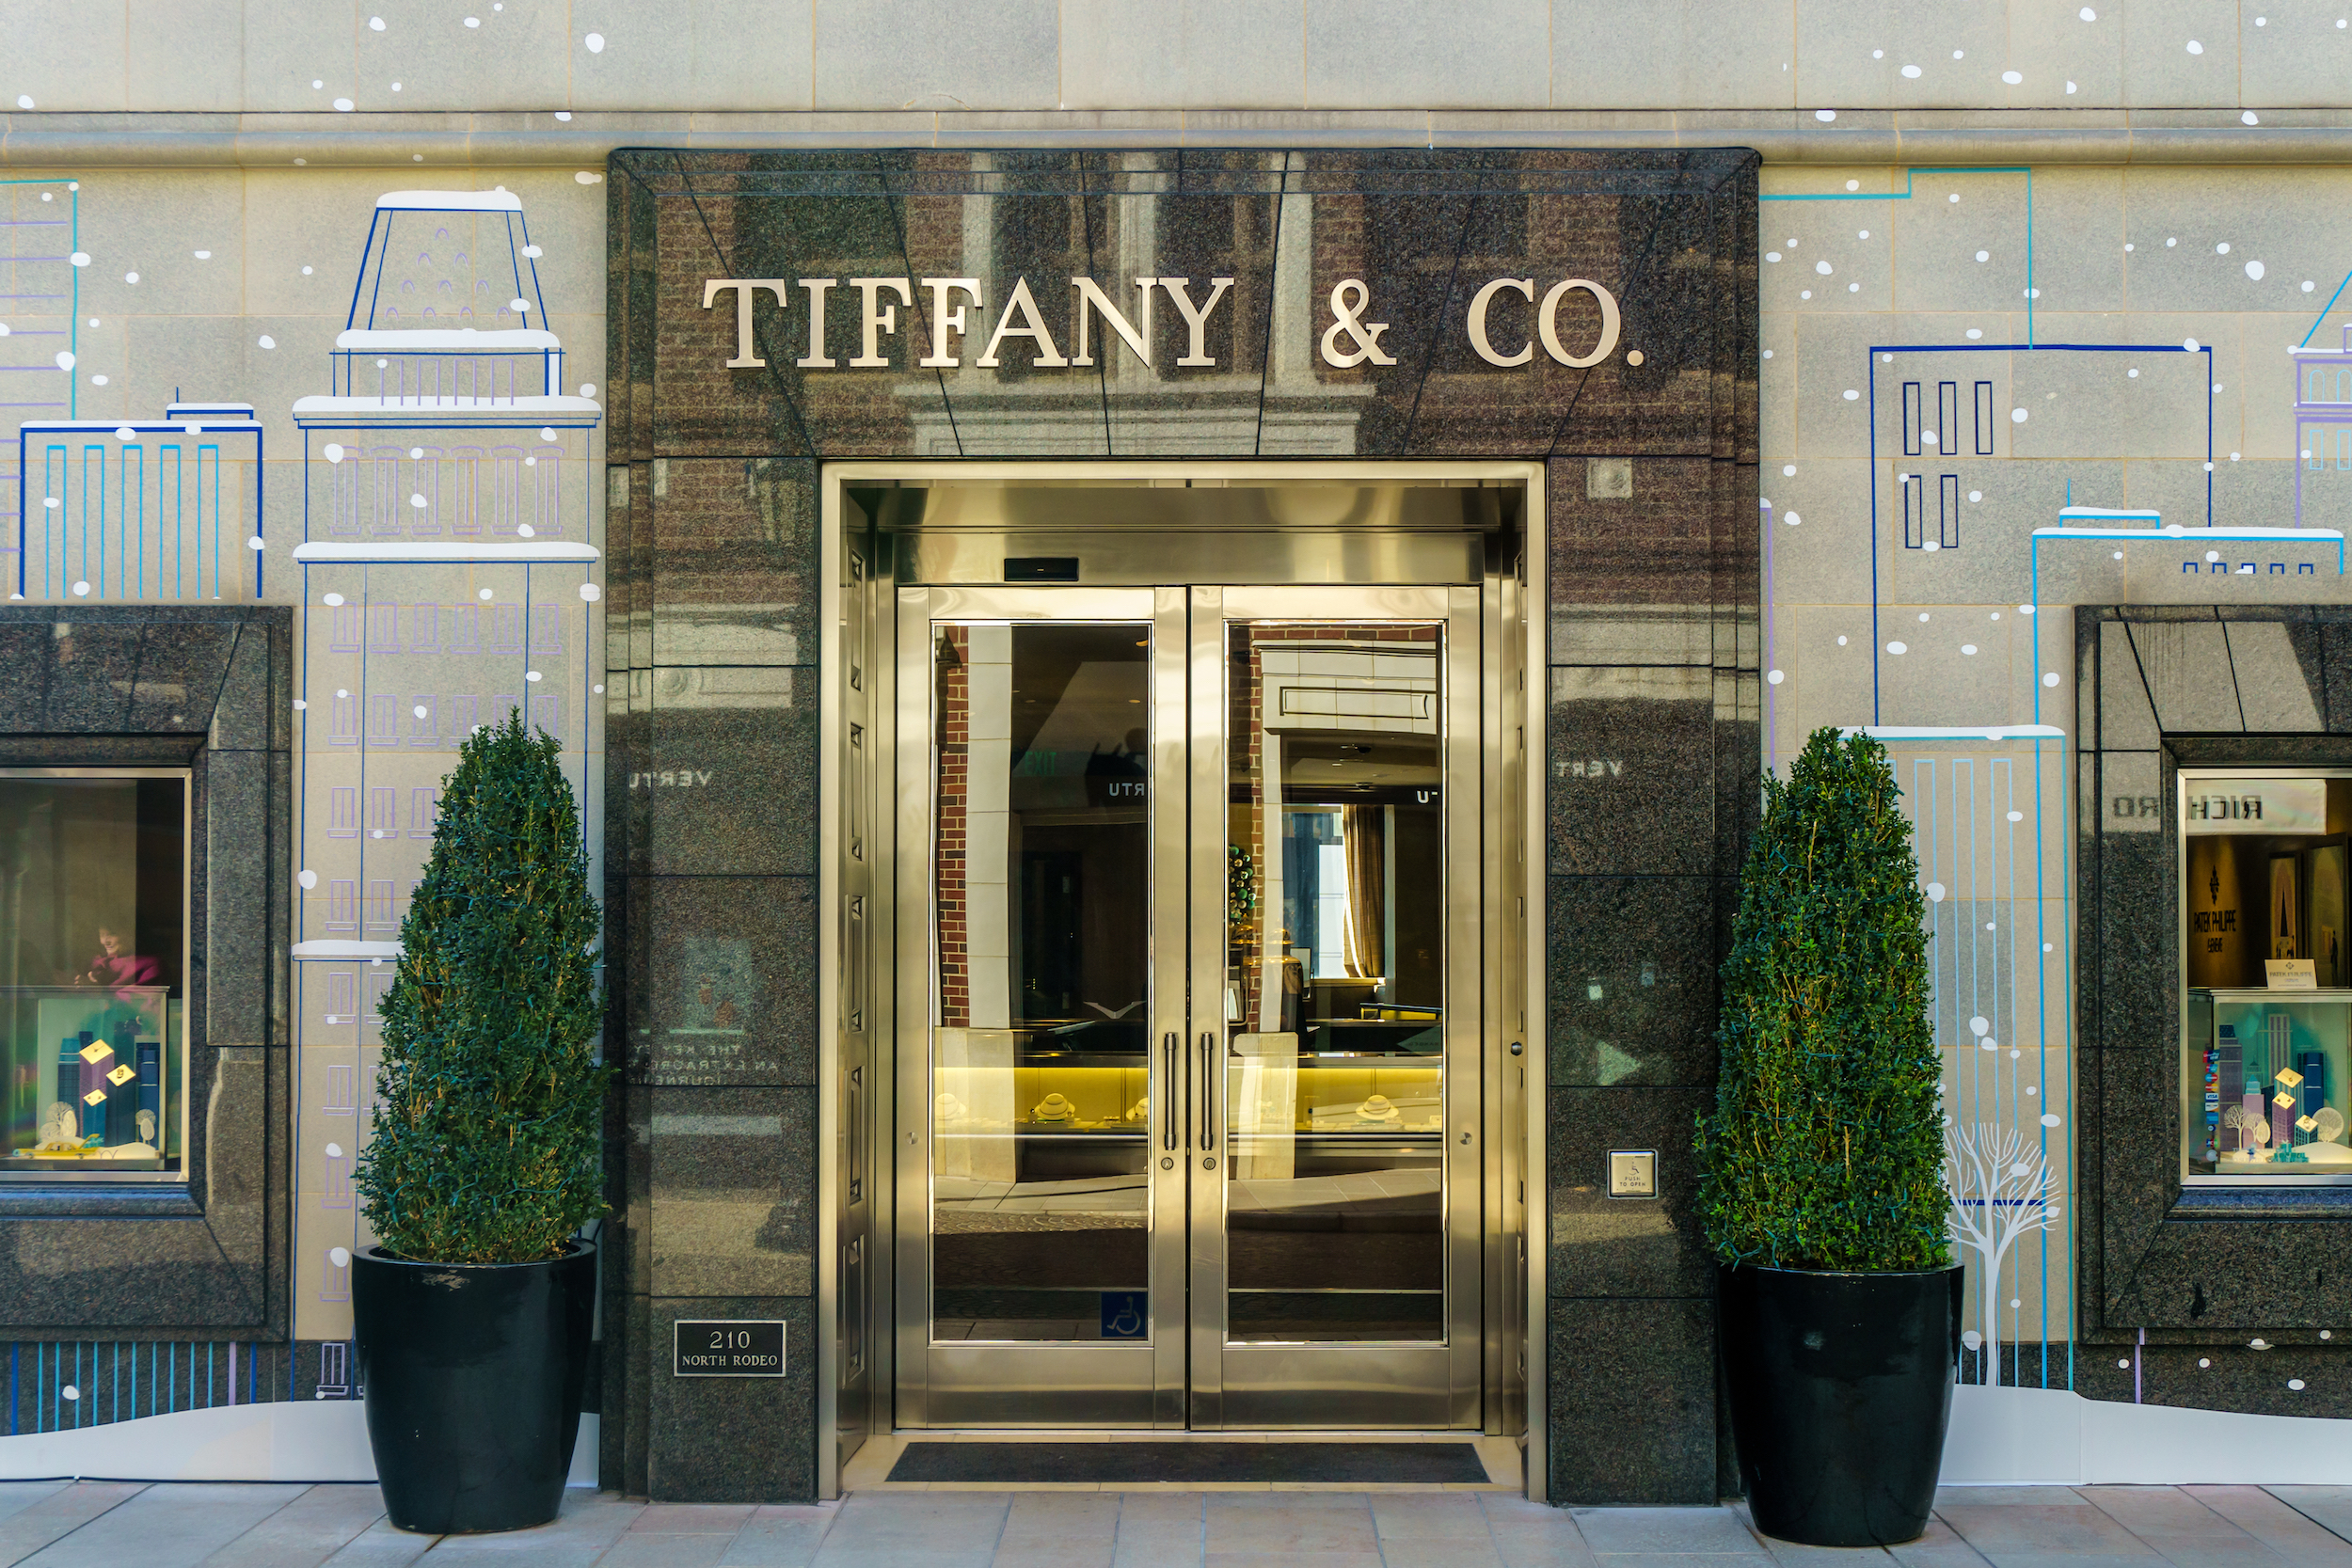
Editorial Credit: Ken Wolter / Shutterstock.com
Reader Comments (15)
Comments are presented chronologically, with replies indented beneath the comments to which they respond.
colemanhawkins
January 7, 2016
If you haven't, next time you're in NY check out the rifles at the Met.
Joshua Kennon
January 12, 2016
Replying to colemanhawkins
I'll try to do that. Thanks for the suggestion!
Jeff
January 7, 2016
Thanks for the information on the Swatch deal gone bad. That explains the dip I saw on the net income as reported by Google. I had only started reading the annual report.
Derek
January 7, 2016
Wow! That's a fortunate update. TIF was next on my research list after I saw a stock quote a couple days ago and realized it had dropped significantly from last summer.
Roundball
January 7, 2016
Thanks for the article. I would love to see the price at around $50- which could happen in the near future. At the current price of $70, you should still see satisfactory returns long term. One quibble I have is their share repurchases haven't made any difference to the sharecount over the past few years. BTW, is anyone else slightly giddy about a 10% correction to start the year?
dave (nestle)
January 8, 2016
Replying to Roundball
Rhetorical ? above...
Ecstatic actually. And,look at the put premiums(for sellers) at at least another 10 percent lower than these stock prices.(some nice opportunities to mitigate lower price risk while getting the shares(potentially) at very nice earnings(and dividend) yields)
Happy New Year!
Joshua Kennon
January 12, 2016
Replying to Roundball
Share repurchases were effectively halted when the stock became overvalued at the same time they needed to come up with ~$500 million in cash for the Swatch arbitration loss that has subsequently been reversed (with none of the cash, yet, returned). The buy backs that were executed in the years around this time were all but entirely restricted to undoing dilution caused by management incentive programs, the net consequences being that the equity compensation got converted into cash compensation so owners weren't hurt long-term. That has recently begun to change. In the first nine months of this fiscal year, compared to those of the same period last year, repurchases have increased by 5.23-fold. Unless earnings are slammed substantially by the economic slowdown in China, I would expect over the coming 5-7 years management will repeat its behavior up until 2009, when they bought back and retired large amounts of stock.
To be frank about it, I think Tiffany's management is one of the best capital allocators I've ever observed in the luxury retail space. Between 1990 and 2000 when the stock market became obscenely overvalued, they began having the firm print and sell newly issued shares like crazy, increasing outstanding share count from a split-adjusted 125,552,000 to a split-adjusted 151,816,000, the money being used to expand the stores across the world. A few years later when the global economy fell apart in the dot-com collapse and post-September 11th recession, President Bush pushed through a tax repatriation holiday. They leveraged their Japanese assets, replaced the equity with low-cost debt, then brought home (free from corporate tax) all of those decades of profits generated in Asia. They then used the liberated wealth, along with funds generated from operations, to buy back the stock at a fraction of the price for which they had been issuing it earlier, reducing share count from a split-adjusted 125,383,000 by the 2009 collapse. Over this same period, the dividend increased by 6,400% from a split-adjusted $0.025 per annum per share to $1.60 per annum per share. I get whispers of Teledyne in the way Michael Kowalski (who came to Tiffany from its days as an Avon subsidiary) and his employees ran the financial statements. Perhaps it shouldn't be a surprise given that he's an economist. I'm a bit sad to see him give up his post as long-time CEO, though he will still remain Chairman of the Board, serves on Tiffany's private charitable foundation, and maintains a personal stake of more than $5,000,000 despite selling off a lot of his holdings to diversify for retirement now that he's handed over the baton.
That is to say, I'm not concerned about the recent share repurchase activity to any meaningful degree other than noting it in my markup. The new CEO spent years in this culture and seems to be behaving the same way so I don't expect substantial departure from the prudent policies of the past. My biggest criticism with the place is that 1.) I think they are taking inventory efficiency initiatives way too far to the point it hurts the brand and shopping experience. The local boutiques have all but removed things like fine china and housewares (vases, etc.), with even the website being nearly sold out of everything to the point I'd rather just go to Michael C. Fina, Borsheim's, Bloomingdales, or Neiman Marcus, and 2.) they've feminized the brand, removing nearly all masculinity up until the recent marriage equality push and reintroduction of in-house watches, which I hope is a commitment to men. Harry Winston, for example, generates a majority of its substantial watch revenue from guys, which is extraordinary in the jewelry business. Coach is expanding its men's selection because they had no idea the kind of demand that was there - it turns out, men like buying stuff for themselves, too. I think we're on a 25+ year upswing of the male consumer really coming into his own and Tiffany, right now, has almost nothing out there to take advantage of it compared to many of their competitors; not like LVMH, Hermes, and Burberry. Were I working for Tiffany, it would be my total obsession and focus. I think they could dramatically expand the brand in the coming decade by building an in-house men's line of things like leather products a la Louis Vuitton. For heaven's sake, this was a place that once sold kickass guns and pocket watches. Even the few things they have for men are feminized like that Elsa Peretti shaving set that isn't anywhere near as attractive to most men as something like Truefitt & Hill or The Art of Shaving. Even Montblanc ... look at what Richemont has done with it, turning the pen company into a purveyor of upper class lifestyle for both men and women. I think Tiffany needs to do some catching up here.
The rise of synthetic diamonds and comparable gemstone substitutes is my big risk factor, though I'm not too worried about it. My single biggest "watch this like a hawk" item is the tendency to generate outsized returns from comparably cheap silver jewelry under $500. Management is very careful to explain that they do internal analysis to protect the brand while sometimes purposely pursuing profit opportunities because they know the brand can support it but I don't like the idea that some girl in high school can walk in and buy a cheap $150 bracelet or necklace. It makes it more like a mall store and definitely hits the brand equity (random side-note, there is something going on at Zales that I need to look into because the quality of their merchandise, such as watches, has increased recently - there are some watches in the $2,000 to $3,000 range that you ordinarily wouldn't see in one of their boutiques that are now being marketed). I don't even like that these sorts of comments are showing up on the Internet from time to time if you start lurking on forums. The "fashion jewelry" as it is called makes up 41% of reportable segment sales (God bless the Japanese, for they are the big holdout here as fashion jewelry makes up only 27% of that region's sales). It's lucrative but ... I don't like it. I don't like it at all.
I love that, like Apple, they never engage in promotional activities (though, if you're smart, you'll open a business account and get a 15% discount). I love that their efficiency is so impressive (around $3,100 sales per square foot at industry-leading margins). I love that they purposely spend more than competitors to make the customer experience incredible (stores are overstaffed with experts compared to what they should be, packaging is more expensive than what it should be). I love that they understand mental models (e.g., they purposely select store locations to be in close proximity to non-attainable brands so the mere association effect influences customer perception of their own products). I love that they own the New York headquarters building, which is a hugely undervalued hidden asset on the balance sheet, making the company even cheaper than it might appear (they famously sold it to the Japanese at the height of the real estate bubble in the 1980's then repurchased it in 1999 for something like $94 million - it's worth a hell of a lot more today and none of that is in the financial statement due to GAAP rules). I love that they strategically make investments in mines to secure inventory despite sometimes lowering returns on capital, which demonstrates they are superior operators and not merely bean counters with business degrees.
I've placed orders for it in one account or another nearly every day since I posted this (even this morning, I had my parents add to their position) as I'm happy with the price for a long-term owner but were we in the mid-50's, all else equal and assuming we didn't plummet straight off a cliff into a 1929-1933 almost immediately, it would be very, very difficult, in my estimation, for a long-term owner to do anything but enjoy an extremely satisfactory total return regardless of the volatility he or she would have to suffer. I'd have a hard time seeing how you couldn't almost assure yourself of an 12%+ long-term compounding rate in a very tax efficient way based on most reasonable profit distribution estimates and valuation multiples. Of course, the world is uncertain, crazy things happen, and any firm can go bankrupt but that's what diversification and portfolio weightings are designed to counteract. If something did go bad, you have Hershey, Diageo, Coca-Cola, Johnson & Johnson and the other components healing the damage, replenishing the funds with dividends and unrealized capital gains.
Derek
January 15, 2016
Replying to Joshua Kennon
It's interesting you mention the risk of diluting the brand with inexpensive items. I mentioned the same concern to my wife a couple years ago when she went shopping for a new set of glasses and I saw the licensed Tiffany & Co. frames mixed in with everything else and at similar prices to most other frames. I thought it risked cheapening the brand for what's overall a fairly small licensing agreement.
I'd been looking to purchase some TIF shares for my "forever" portfolio ever since my first experience with the company purchasing an engagement ring and wedding band a few years ago. After catching up on the changes over the last several months and going over the past few annual reports again I finally felt comfortable placing the buy order. If it keeps falling I may add to it, though I suspect that if TIF is in the 50s there will be a lot more great companies trading at fair prices competing for my money.
Roundball
January 25, 2016
Replying to Joshua Kennon
Thank you for the response! I am reading "The Outsiders" right now, and any talk of Teledyne, Henry Singleton and increasing metrics on a per-share basis gets my pulse racing.
innerscorecard
January 8, 2016
You know, the couple in the ad even look a little bit like you and Aaron, perhaps due to the hair colors and clothing choices. I'm sure you have something to say about demographics for that.
I really like your point about the risks of getting bought out in a take-private transaction, and how that is an argument for diversification rather than concentration. I hadn't thought about it that way, but it really is a profound point. In fact, that is a risk that increases the more undervalued a company is, which seems quite dangerous. Market cap is also a factor, which is interesting.
Bo
January 13, 2016
After years of waiting, this high quality business seems to be coming down to fair value indeed. The recent volatility in the markets opens up some possibilities to add some. After years of waiting I finaly pulled the trigger on Hershey and Tiffany stock to add to my diversified blue chip portfolio.
I'd love to see more volatility in the markets. McCormick and Brown-Forman are high on my "want-list". But every few months I reread the latest annual reports of the companies I say to myself "It's just too darn expensive for my taste at this moment". One can hope, one day, one day...
Stephen H
January 15, 2016
Replying to Bo
One I'm watching to snag more is Hershey. Been sliding down and down lately.
Bo
January 24, 2016
So management announced a new stock repurchase program, $500M over three years on top of the $61M that remains available for the previous stock repurchase program. $500M is good for about 6.3% over current market cap. Management probably thinks the stock is a good buy.
http://investor.tiffany.com/releasedetail.cfm?ReleaseID=951229
Muhammad
February 12, 2016
Hello Joshua, I have a question regarding the idea that its better to pay a fair price for a great business rather than pay a great price for a fair business. My question has to do with the margin of safety concept related to the price we pay for a great business.
Here is my question: When we say "I would pay a fair price for a great business." do we mean we will pay the fair price (or intrinsic value) without subtracting margin of safety? At-least that is what I have understood from hearing Warren Buffett and you talk about the idea of paying a fair price for a great business. would you please shed some light on this. Thanks!
Ang
March 29, 2016
Replying to Muhammad
This is a topic I always kick around in my head as I research investments. My opinion on this is that it's related to the growth/economic engine underlying the business. If you have a fair business that has limited prospects for earnings growth, say 3% a year, and you get it at a 30% discount, in 10 years (if it gets back to fair value), you will have an 86% return on your investment. If you buy a great business growing 10% or 15% a year, and you pay fair value, in 10 years, if valuation is the same, you will achieve a 136% return on your investment. The margin of safety, then, is in the quality of a business.
High quality businesses are consistently undervalued. The reason some of the nifty fifty businesses worked out as investments is because the quality was so great it gave you a good return after enough time of compounding as the underlying economic engine roared along all those years.
The analysis in this case requires a very long term view and thinking about metrics and reality other than just the historic numbers. In coke's example, you had to think about the return on INCREMENTAL invested capital, the addressable market, ability to deploy the free cash flow, among many other things. All of this is extremely difficult, and I think buying cigar butts, so to speak, is a lot easier. (Although even that approach requires a great deal of good temperament and hard work, and can make you quite a bit of money)